Usage dashboards
This article explains how to import pre-built usage dashboards to your workspaces to monitor account- and workspace-level usage.
To access the Usage page, as an account admin go to the account console and click the Usage icon.
Import a usage dashboard
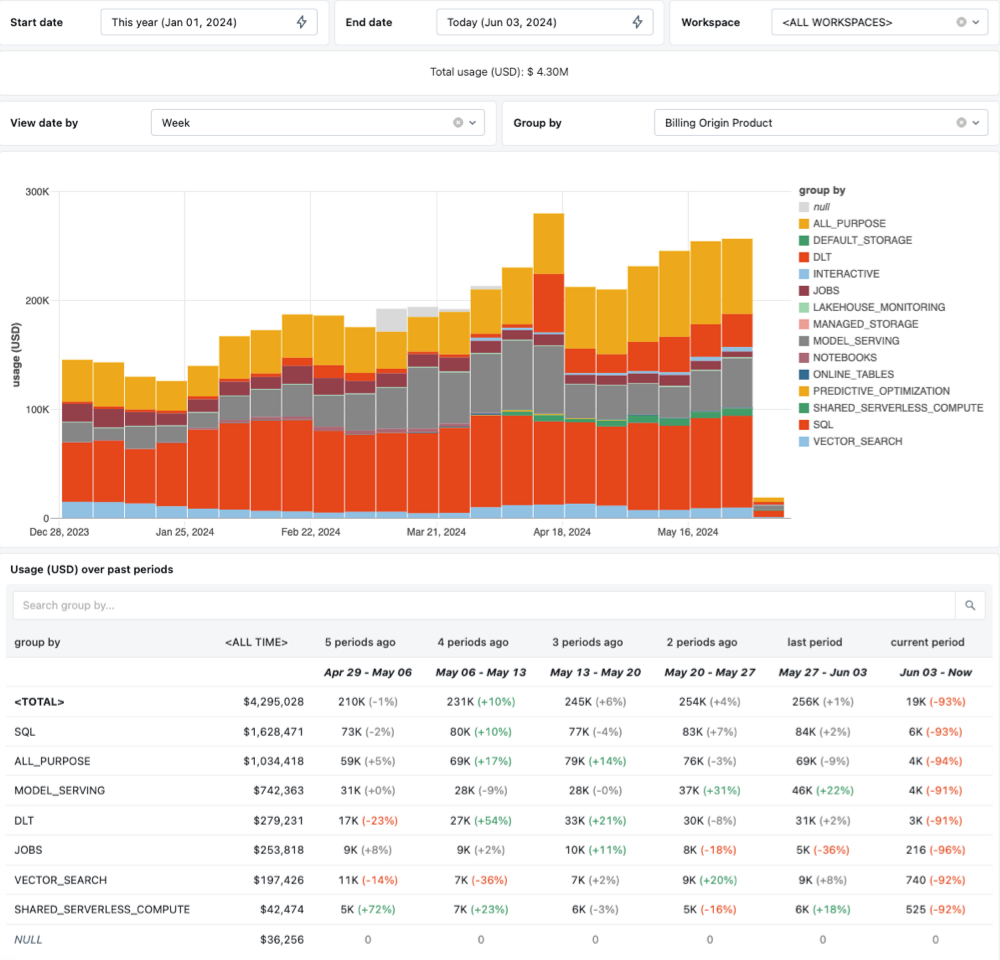
Account admins can import customizable usage dashboards to any Unity Catalog-enabled workspace in their account, as long as the account admin is also a user of the target workspace. By default, the dashboards contain usage breakdowns by product, SKU name, and custom tags. Dashboards also contain an analysis of the most expensive usage source.
To import the dashboard:
- From the account console, click the Usage tab.
- Click the Setup dashboard button.
- Select the dashboard version.
- Usage Dashboard version 2.0 (Preview): includes cost forecasting and object-level cost drill-down.
- Select whether you want the dashboard to reflect the entire account's usage or just the usage from the single workspace.
- Select the workspace where you want to send the dashboard.
- Click Import.
After you click Import, you are redirected to the new dashboard. The dashboard is fully customizable and can be published like any other dashboard. You can also reimport a new version of the dashboard at any time.
To use the imported dashboard, a user must have the SELECT permissions on the system.billing.usage and system.billing.list_prices tables. The dashboard's data is subject to the usage table's retention policies. See Which system tables are available?.
Consumption (Legacy) tab
The Consumption (Legacy) tab in the account console Usage section provides a usage graph and CSV downloads.
The Consumption (Legacy) tab includes legacy consumption data. Databricks recommends referencing data from the billing system tables instead. See Billable usage system table reference.
Usage graph
At the top of the Consumption (Legacy) tab, a graph shows your account's usage in DBUs or the estimated cost in $USD. Use the **$USD/DBU** picker to toggle between these views.
You can also use the aggregation picker to browse the data by the following:
- Total usage: A single line for the account's total usage across all workspaces and SKUs. This is the default selection.
- Workspace: A line for each workspace's usage.
- SKUs: A line for each SKU's usage. The set of SKUs shown for your account depends on your contract. SKUs also depend on how you use Databricks. See Pricing.
- Tags: A line for each resource that includes the selected tag.
If there are more than 10 workspaces, SKUs, or tag values, the chart displays the nine with the highest usage. The usage of the remaining workspaces, SKUs, or tag values is aggregated and displayed in a single line, which is labeled as combined.
If you browse data by tags, usage without the selected tag is aggregated and displayed in a single line labeled “(… tag absent).”
Filter by workspace, tag, or SKU
You can use the graph's legend or the line picker to filter out the graph lines as follows:
- To show or hide a line, click the line's radio button in the graph's legend or the line's checkbox in the line picker.
- To show a single line, double-click on the line's radio button in the graph's legend or the line's checkbox in the line picker. You can then double-click it again to restore the view and show all lines.
The actual cost varies depending on your contract. You can adjust the cost-per-DBU for each SKU in the settings panel to change the cost estimate.
Usage details
In the Usage details panel, you can view a list of detailed usage in DBUs or the estimated cost in $USD in a table format. This panel's data is always aggregated by workspace. The cost is also broken down into SKU groups. To view usage as totals (aggregated) or by SKU, use the graph in the settings panel instead.
To toggle between estimated cost and DBUs, use the $USD/DBU picker.
Use the date range picker to specify an exact time range or choose among predefined options (for example, Last 6 months). The time ranges are in UTC time.
If you have many workspaces, type the workspace name into the search field to filter results.
The actual cost varies depending on your contract. You can adjust the cost-per-DBU for each SKU in the settings panel to change the cost estimate.
Pricing
You can set your actual pricing per DBU by clicking on the kebab menu ![]() in the upper-right corner of the Consumption (Legacy) tab to open the settings panel. Use this panel to adjust estimated pricing per DBU for both the usage graph and the usage details table.
in the upper-right corner of the Consumption (Legacy) tab to open the settings panel. Use this panel to adjust estimated pricing per DBU for both the usage graph and the usage details table.
Each SKU is listed separately. The set of SKUs shown for your account depends on your contract. How usage applies to SKU depends on what you do with Databricks. For example, it depends whether a notebook is run using an automated cluster or as a scheduled job.
Usage downloads
Two types of usage downloads are available from the Consumption (Legacy) tab. You can download the aggregated usage data displayed in your current graph, or download overall usage details by date range.
Download aggregated usage data
To download aggregated usage data, click the download button in the upper-right corner of the graph. This downloads the data currently aggregated on the page to a CSV file, which includes the 999 workspaces, SKUs, or tag values with the highest usage.
Usage data for unselected workspaces, SKUs, and tags is aggregated into groups labeled as combined.
Download unaggregated usage data
You can download all usage data by date in the settings pane. To do this, click the kebab menu ![]() in the upper-right corner of the Consumption (Legacy) tab, and then scroll to the bottom of the pane.
in the upper-right corner of the Consumption (Legacy) tab, and then scroll to the bottom of the pane.
- Select a time range from the month range picker.
- To include usernames, enable Include usernames (email).
- Click Download.