Access query history for pipelines
This article explains how to access query histories and query profiles associated with pipeline runs. You can use this information to debug queries, identify performance bottlenecks, and optimize pipeline runs.
Review query history for pipeline updates
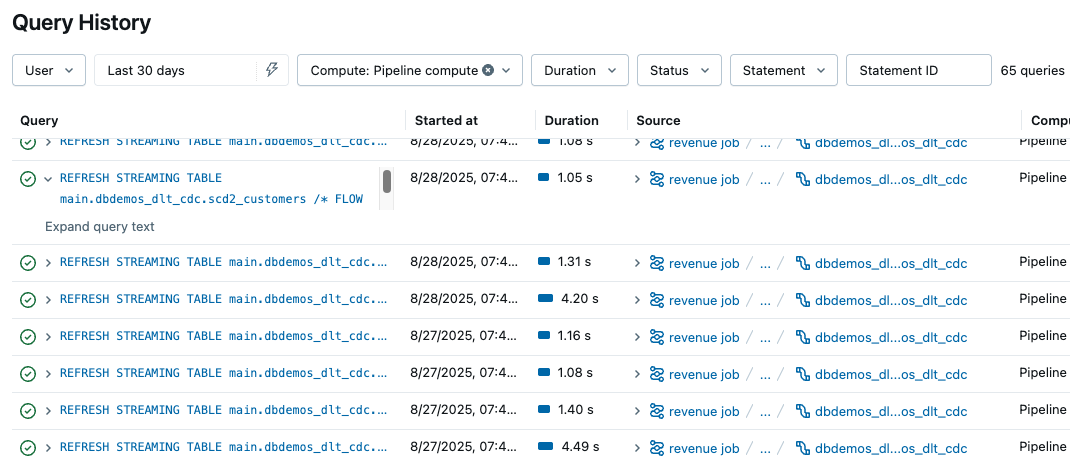
For all ETL pipelines, both triggered and continuous, a query statement appears in the query history when the materialized views and streaming tables are updated. There is one REFRESH statement for every flow execution that updates a target table. You can use the Compute filter on the query history page to show only queries processed using pipeline compute. See Query history to learn more about the query history UI.
To access query details, follow these steps:
-
Click
 Query History in the sidebar.
 -
Select the Lakeflow Spark Declarative Pipelines option from the Compute drop-down filter to show only pipelines.
You can also filter by user, time, status, and other features of the query or update.
-
Click a query statement to view summary details like the duration of the query and aggregated metrics. See View query details.
-
Click See query profile to open the query profile. See Query profile for details about the query profile. You can open the query profile while the pipeline is running or after the run is complete.
-
Optionally, use the links in the Query Source section to open the related pipeline monitoring page.
Access query history from the pipeline monitoring page
From the pipeline monitoring page, click the Performance tab near the bottom of the screen to access the history for your pipeline. You can view the query details panel and profile by clicking on a statement while the pipeline is running or after the run is complete.
Access query history from the Lakeflow Pipelines Editor
When you are editing a pipeline, you can access the query history from the Performance tab on the bottom pane. If you first select a table, the query history is scoped to that table.
Each item in the list corresponds to the execution of a flow defined in your code. There is one statement per table unless several flows write to the same table.
- You can filter this list by dataset name to find the statements for flows that write to that table.
- This list shows up to 1,000 statements. If your pipeline has more statements, you can click View all in query history to see the full list of statements on the Query history page, filtered by the latest Pipeline run ID.
- By default, you can see the duration and metrics for reads and writes. You can click a REFRESH statement in the list to view further metrics and the query profile for the flow.
- The metrics and query profiles are available both while the pipeline is running or after the run is complete.
To learn more about the details available in this view, see View query details.
Limitations
- Provisioning and queued time is not available.