AI usage overview
This feature is in Beta. Account admins can enable it from the account console Previews page. See Manage Databricks previews.
In Governance Hub, the AI page provides a centralized view of AI usage and spend across your Databricks account. It summarizes token usage, how much of your AI traffic is governed, and which models and users are most active. Databricks also surfaces recommendations to improve AI governance across the account.
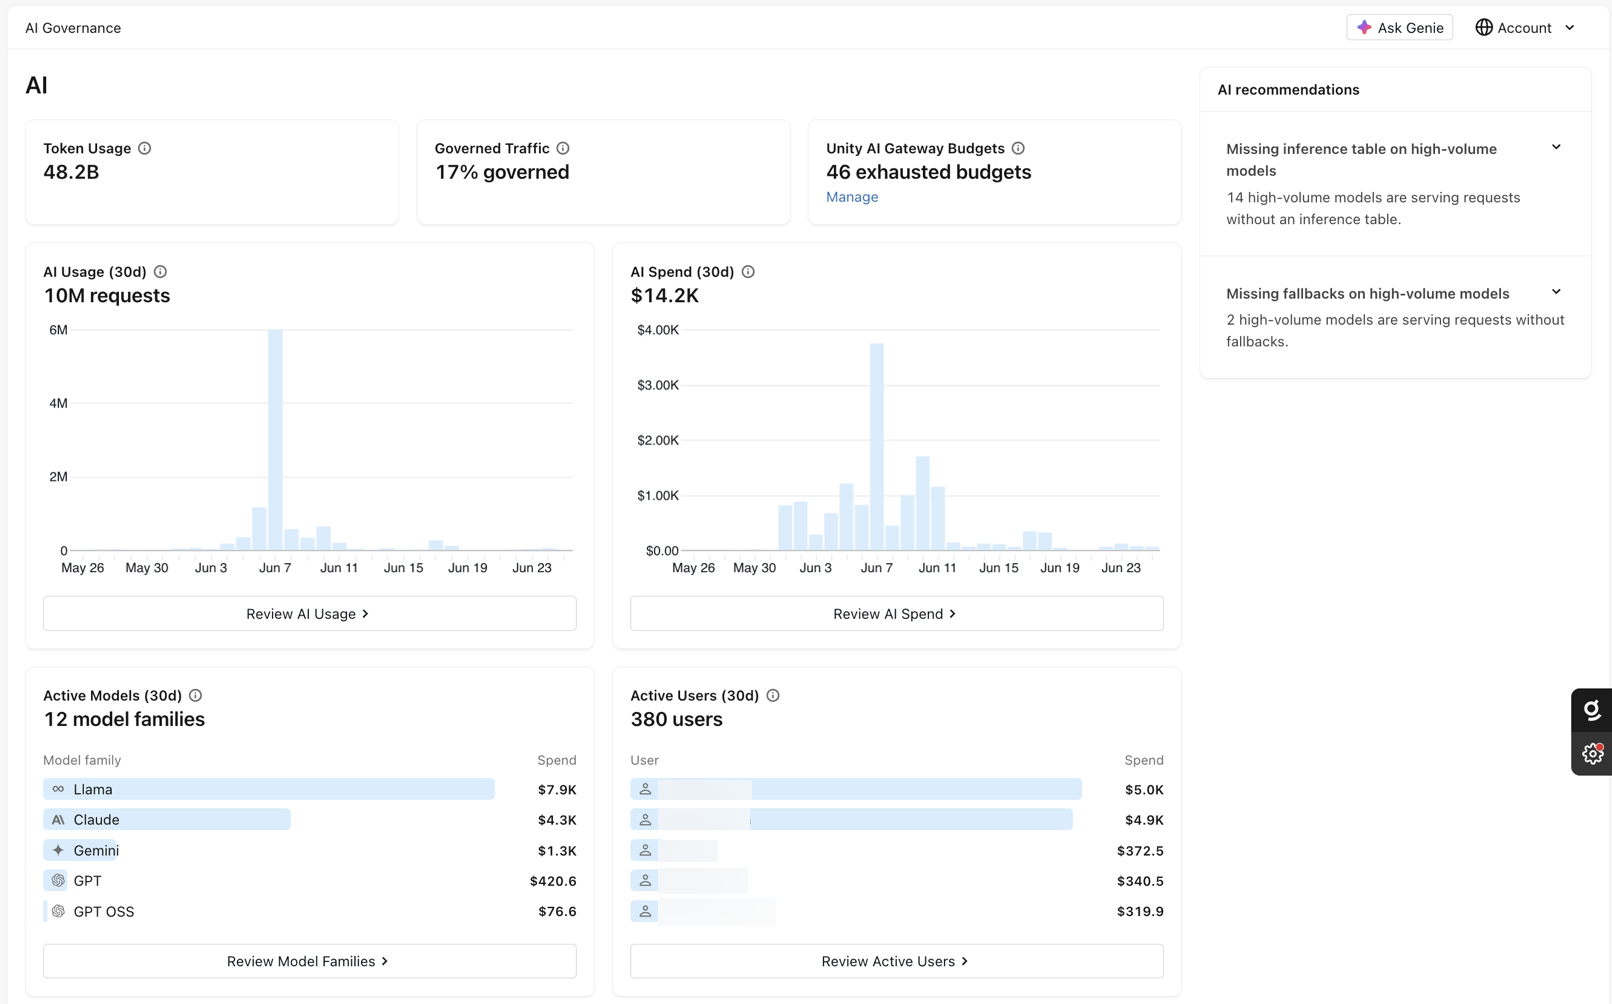
The AI page includes the following tiles:
Tile | Description |
|---|---|
Token Usage | The total number of tokens used in scope. |
Governed Traffic | The percentage of AI traffic covered by AI guardrails in scope. |
Unity Gateway Budgets | The status of your AI budgets in scope. See View and manage AI budgets. |
AI Usage | AI usage over time in scope. See View AI usage. |
AI Spend | AI spend over time in scope. See View AI spend. |
Active Models (30d) | The most active models over the last 30 days in scope. See View active models. |
Active Users (30d) | The most active users over the last 30 days in scope. See View active users. |
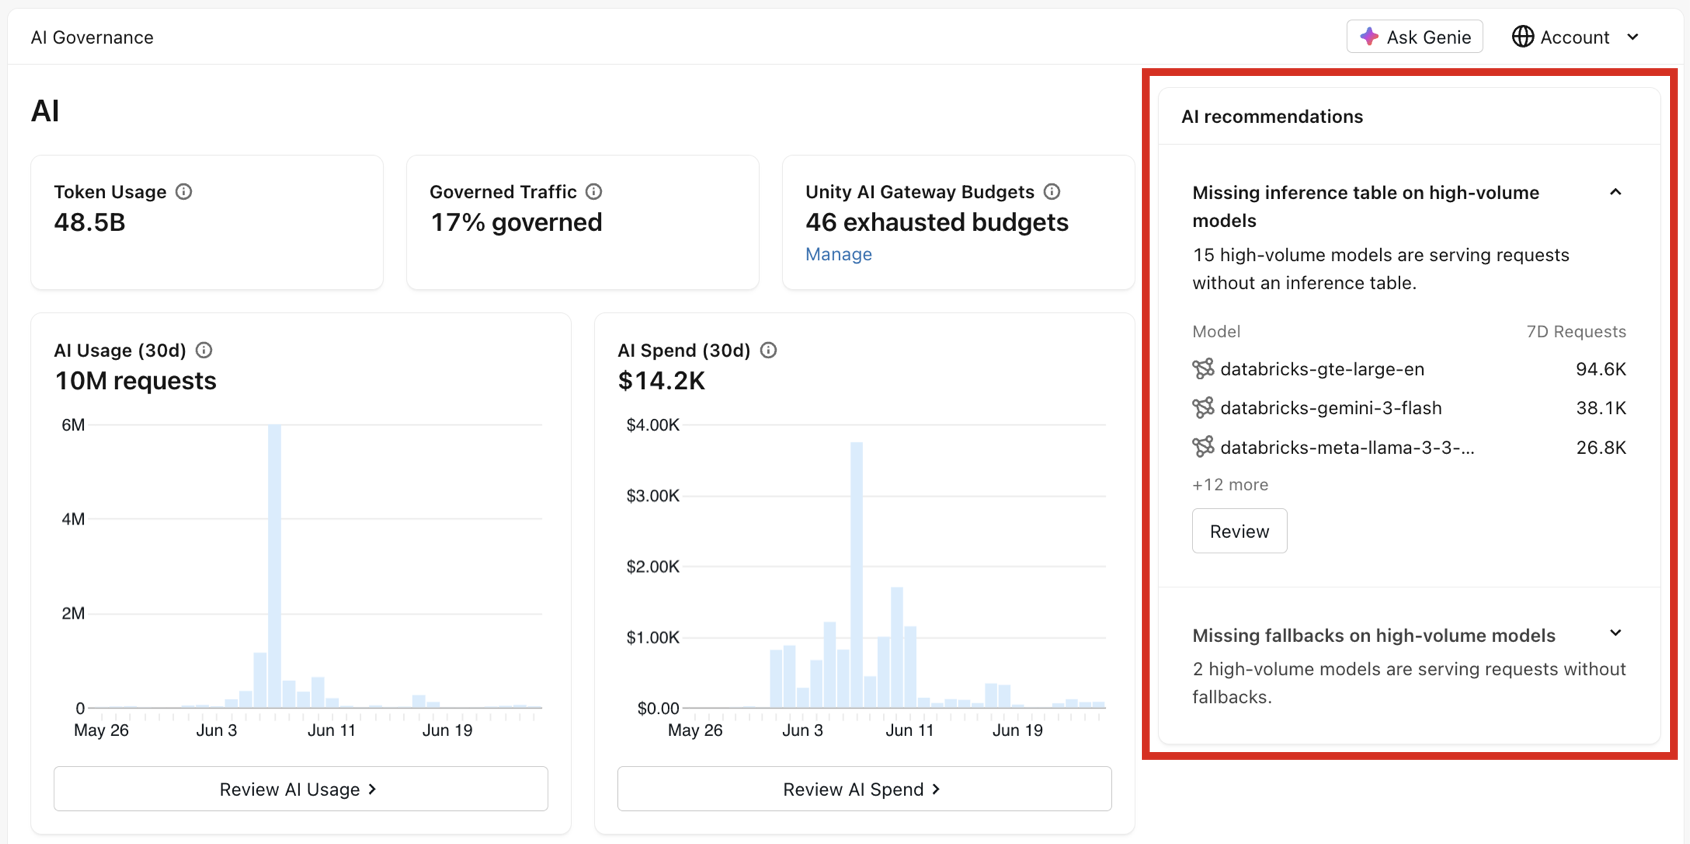
The AI recommendations panel on the right suggests actions to improve AI governance across the account. See Improve AI governance with recommendations.
Change the scope
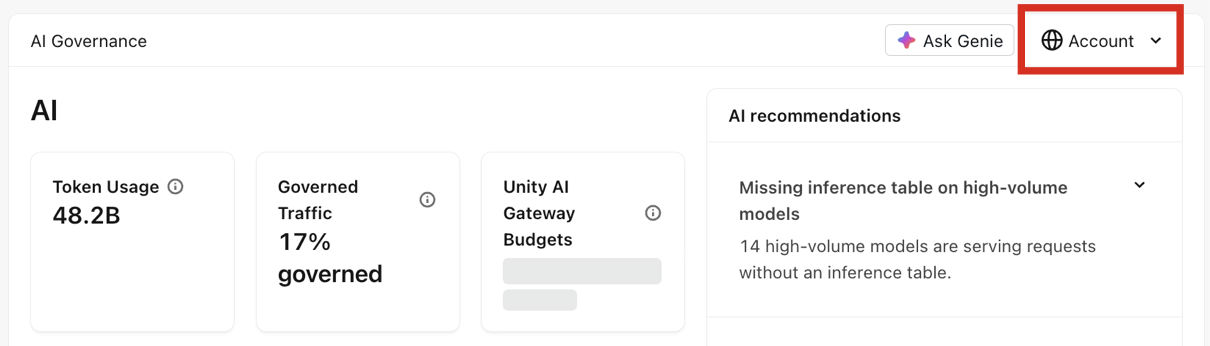
In Governance Hub, the data displayed depends on the chosen scope, which you can select in the top right corner. For account admins, this is set to  Account by default. Select a different scope, such as an individual workspace, to update the dashboards to reflect that scope. For more information about who can view each scope, see Access and permissions.
View and manage AI budgets
The Unity Gateway Budgets tile tracks the status of the AI budgets in the chosen scope. You can click Manage to open the Budgets page. Databricks automatically filters the results down to budgets where Unity Gateway is the resource type, and where the spending threshold has been exhausted.

- The Shared status column shows how much spend in the current month has exceeded the overall budget threshold.
- The Per-user status column shows how many users, if any, have exceeded the per-user threshold. It also reports how many users have been blocked from additional spending as a result. Click on the value to see details about per-user spend for this resource.
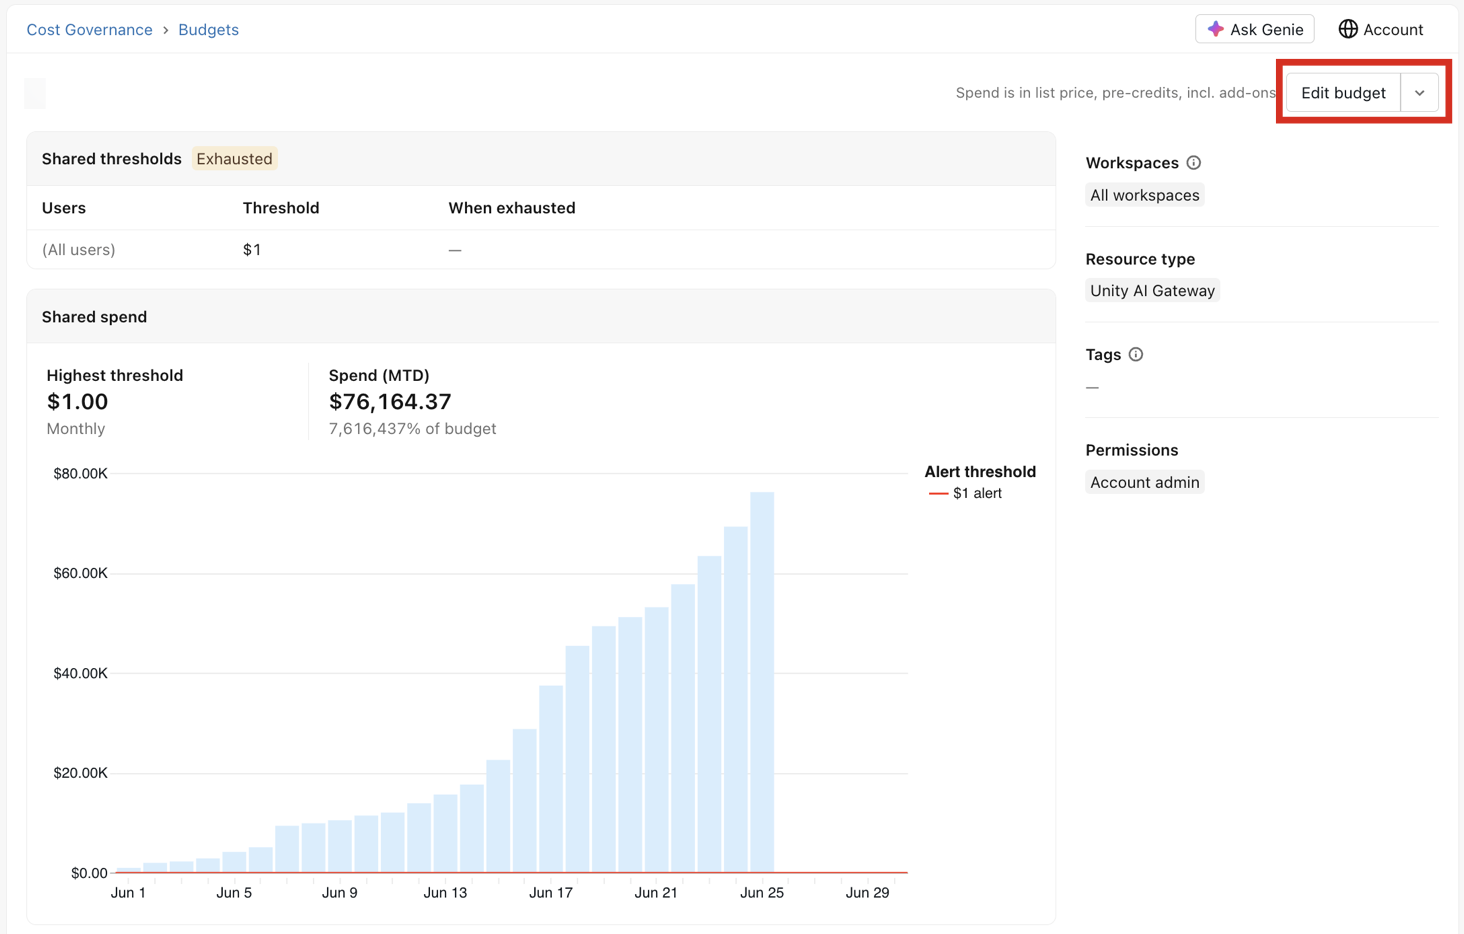
Click on a budget name to view additional details, or to edit it. Each budget page contains a summary of the threshold and spending over the last month. Click Edit budget to modify or add additional thresholds. To delete the budget, click the  icon next to Edit budget, then click Delete budget.
View AI usage
The AI Usage tile tracks the number of model requests within the chosen scope over time. You can click Review AI Usage for details, which opens the AI Usage page.
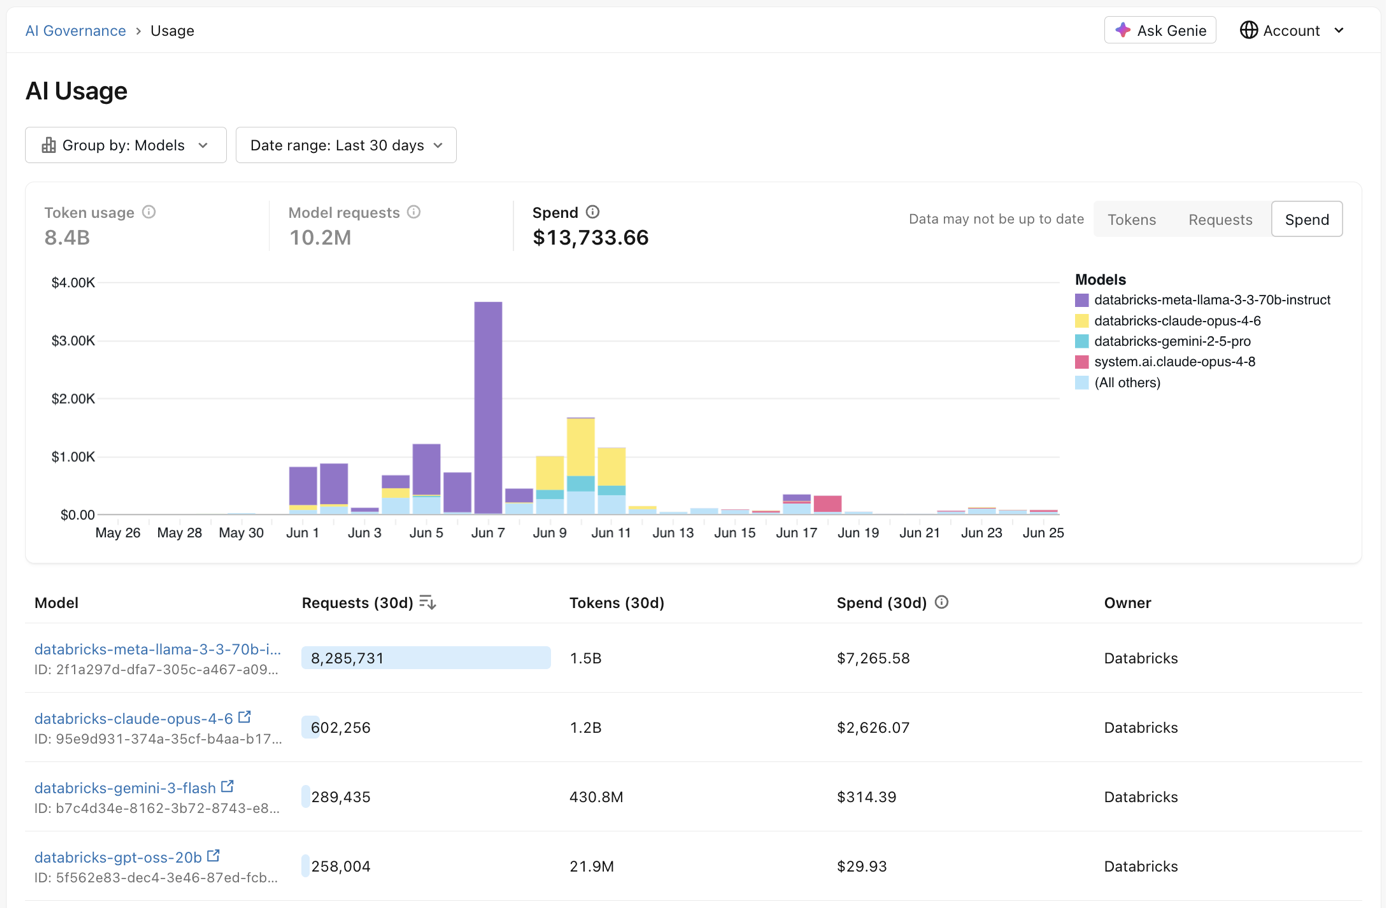
This page contains a set of data visualizations and a list of models ordered by usage. By default, Requests is selected for the visualization. In the top right corner, you can modify this to display Tokens or Spend. In addition, data is grouped by Models over the last 30 days by default. You can modify these settings using the dropdowns in the top left corner.

Clicking on a specific model takes you to the Unity Gateway overview page for the model service. For more information, see Track model usage.
View AI spend
The AI Spend tile tracks AI spend in the chosen scope over time. You can click Review AI Spend for details, which opens the same AI Usage page covered in View AI usage. By default, Spend is selected for the visualization, and the data is grouped by Model.
View active models
The Active Models (30d) tile shows the most active models over the last 30 days as a horizontal bar graph. You can click Review Model Families for details, which opens the same page AI Usage page covered in View AI usage. By default, Spend is selected for the visualization, and the data is grouped by Model Families.
View active users
The Active Users (30d) tile shows the most active users over the last 30 days as a horizontal bar graph. You can click Review Active Users for details, which opens the same page AI Usage page covered in View AI usage. By default, Spend is selected for the visualization, and the data is grouped by Users.
Improve AI governance with recommendations
The AI recommendations panel suggests actions to improve AI governance across the account. Recommendations are read-only. They might include missing inference tables on high-volume models and missing fallbacks on high-volume models. Each recommendation lists the affected models. Click Review to see the full list of findings.