Cost overview
This feature is in Beta. Account admins can enable it from the account console Previews page. See Manage Databricks previews.
In Governance Hub, the Cost page provides a centralized view of Databricks spend and cost drivers across your account. It summarizes recent spend, the products and workspaces driving cost, and how much of your spend is tagged. Databricks also surfaces recommendations to improve cost governance across the account.
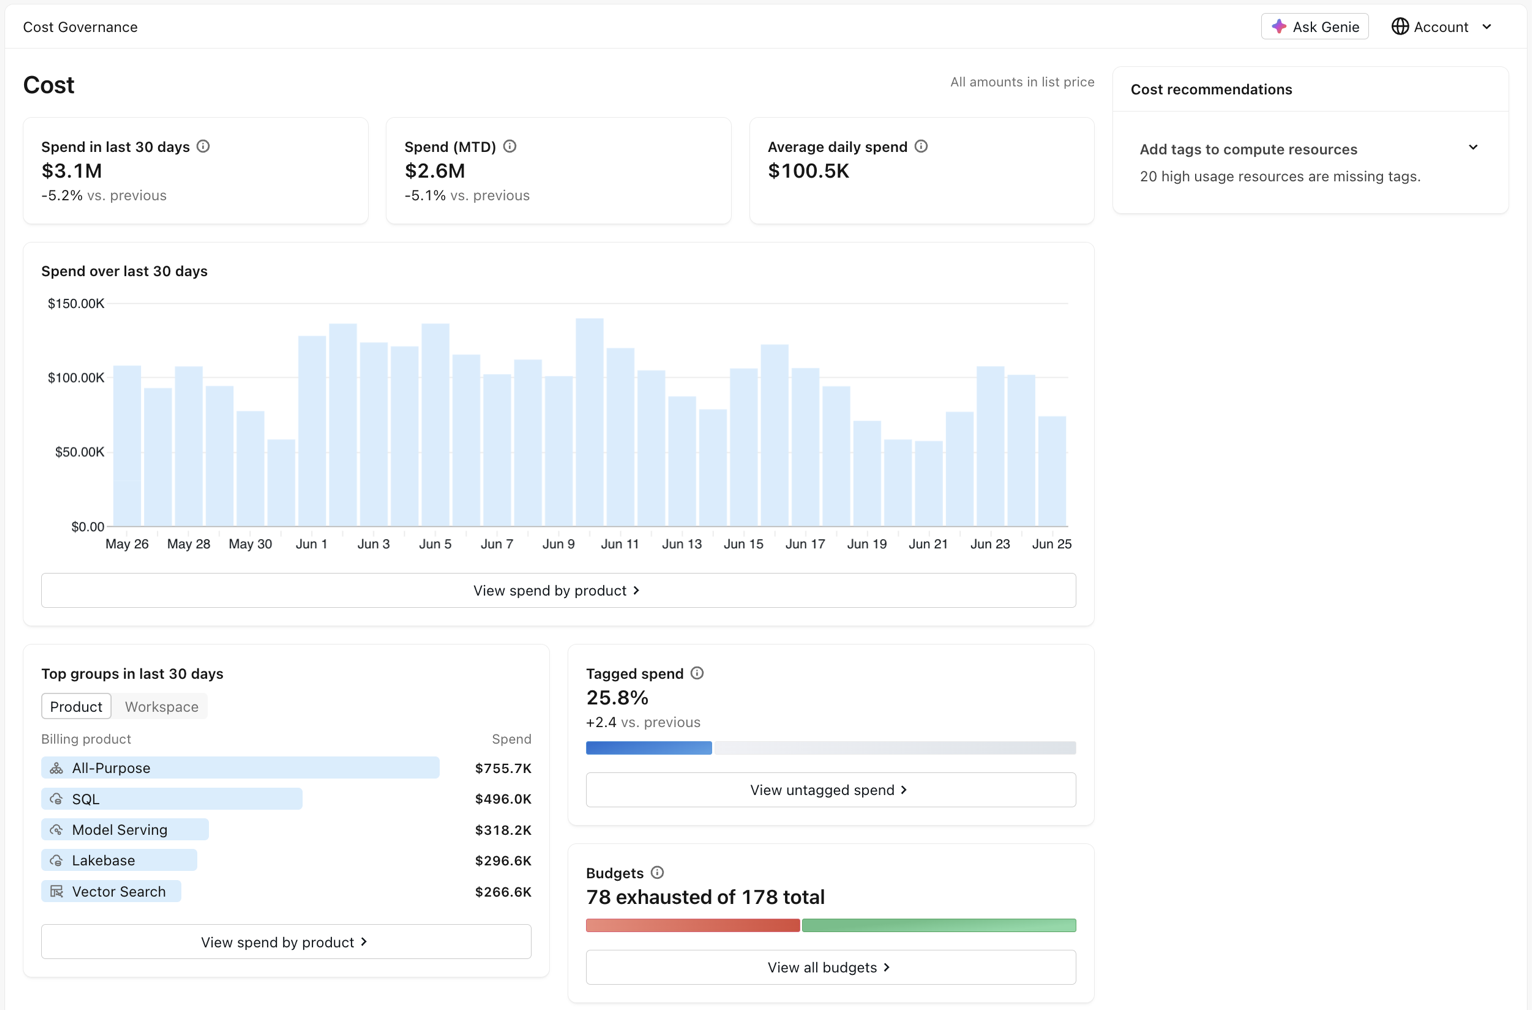
All amounts on the Cost page are shown at list price.
The Cost page includes the following tiles:
Tile | Description |
|---|---|
Spend in last 30 days | Total spend over the last 30 days in scope, compared to the previous period. |
Spend (MTD) | Total spend month-to-date in scope, compared to the previous period. |
Average daily spend | Average daily spend in scope. |
Spend over last 30 days | A daily spend trend for the last 30 days in scope. See View spend over time. |
Top groups in last 30 days | The highest-spending products or workspaces in scope. See View top spending groups. |
Tagged spend | The percentage of spend that is tagged in scope. See View tagged and untagged spend. |
Budgets | The number of budgets that have exhausted their threshold in scope. See View and manage budgets. |
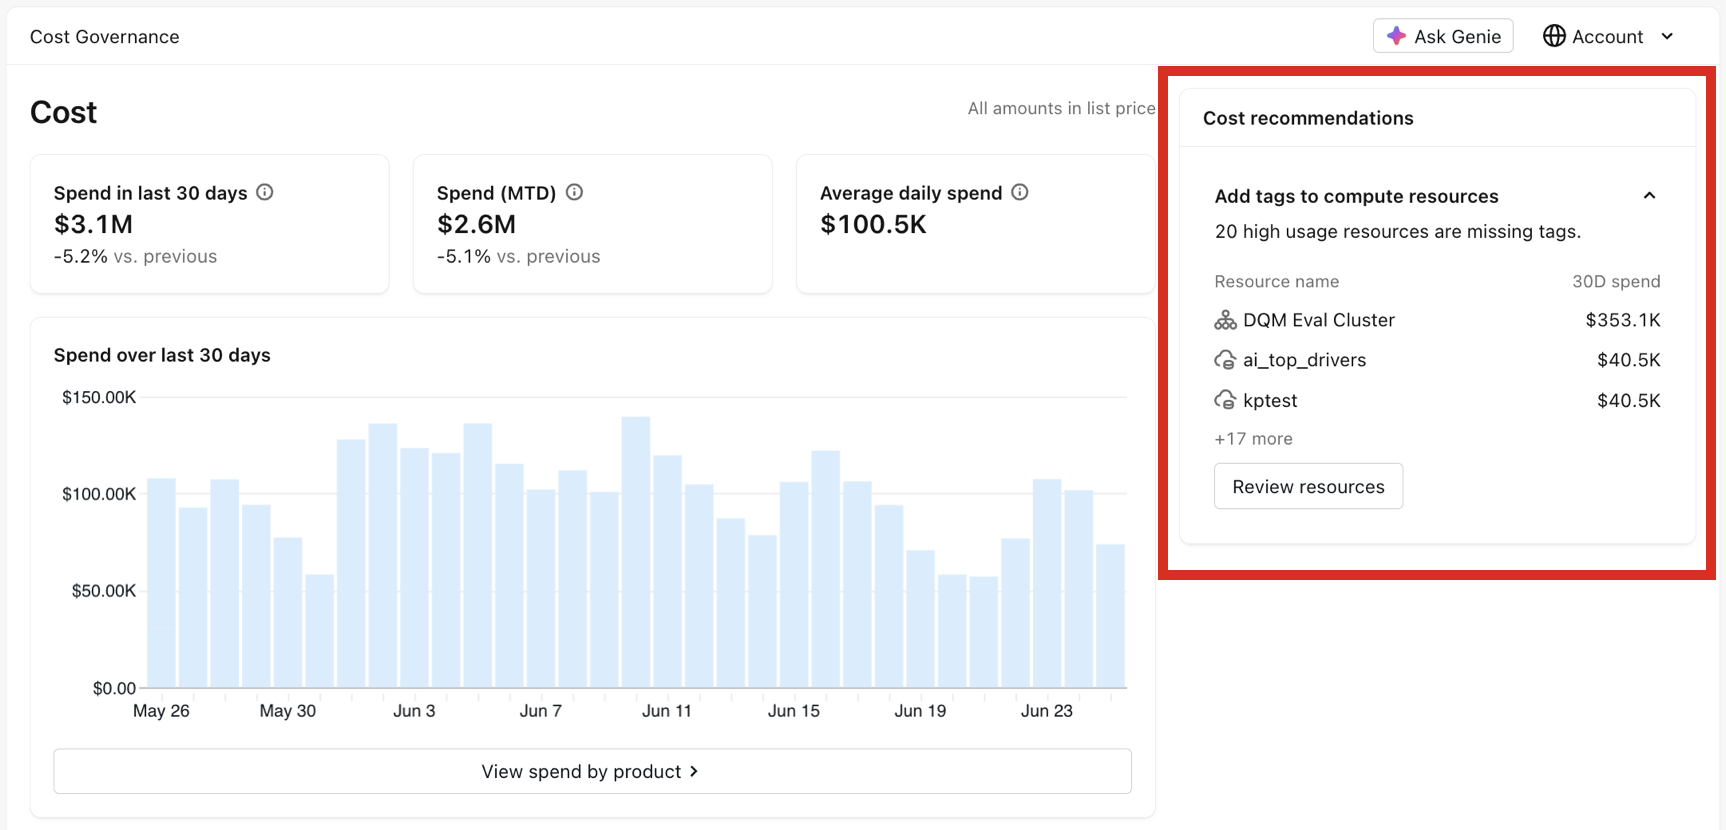
The Cost recommendations panel on the right suggests actions to improve cost governance across the account. See Improve cost governance with recommendations.
Change the scope
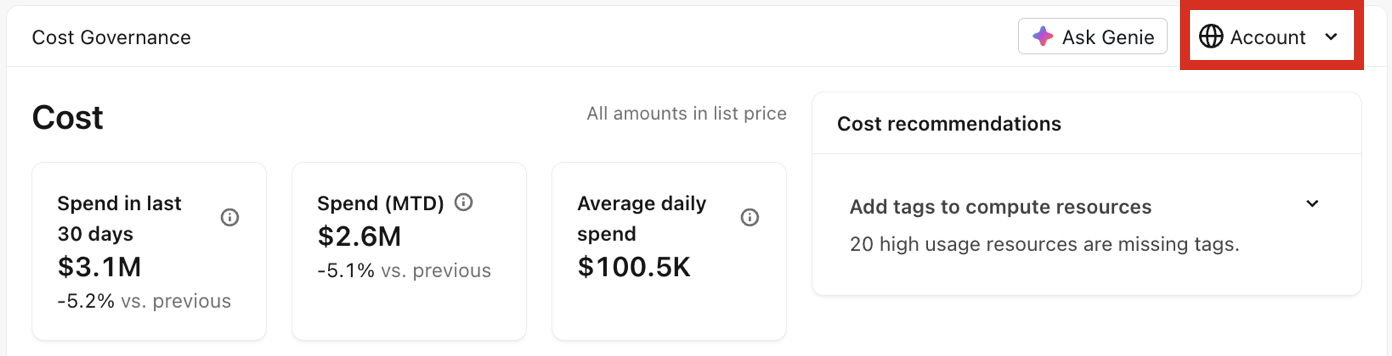
In Governance Hub, the data displayed depends on the chosen scope, which you can select in the top right corner. For account admins, this is set to  Account by default. Select a different scope, such as an individual workspace, to update the dashboards to reflect that scope. For more information about who can view each scope, see Access and permissions.
View spend over time
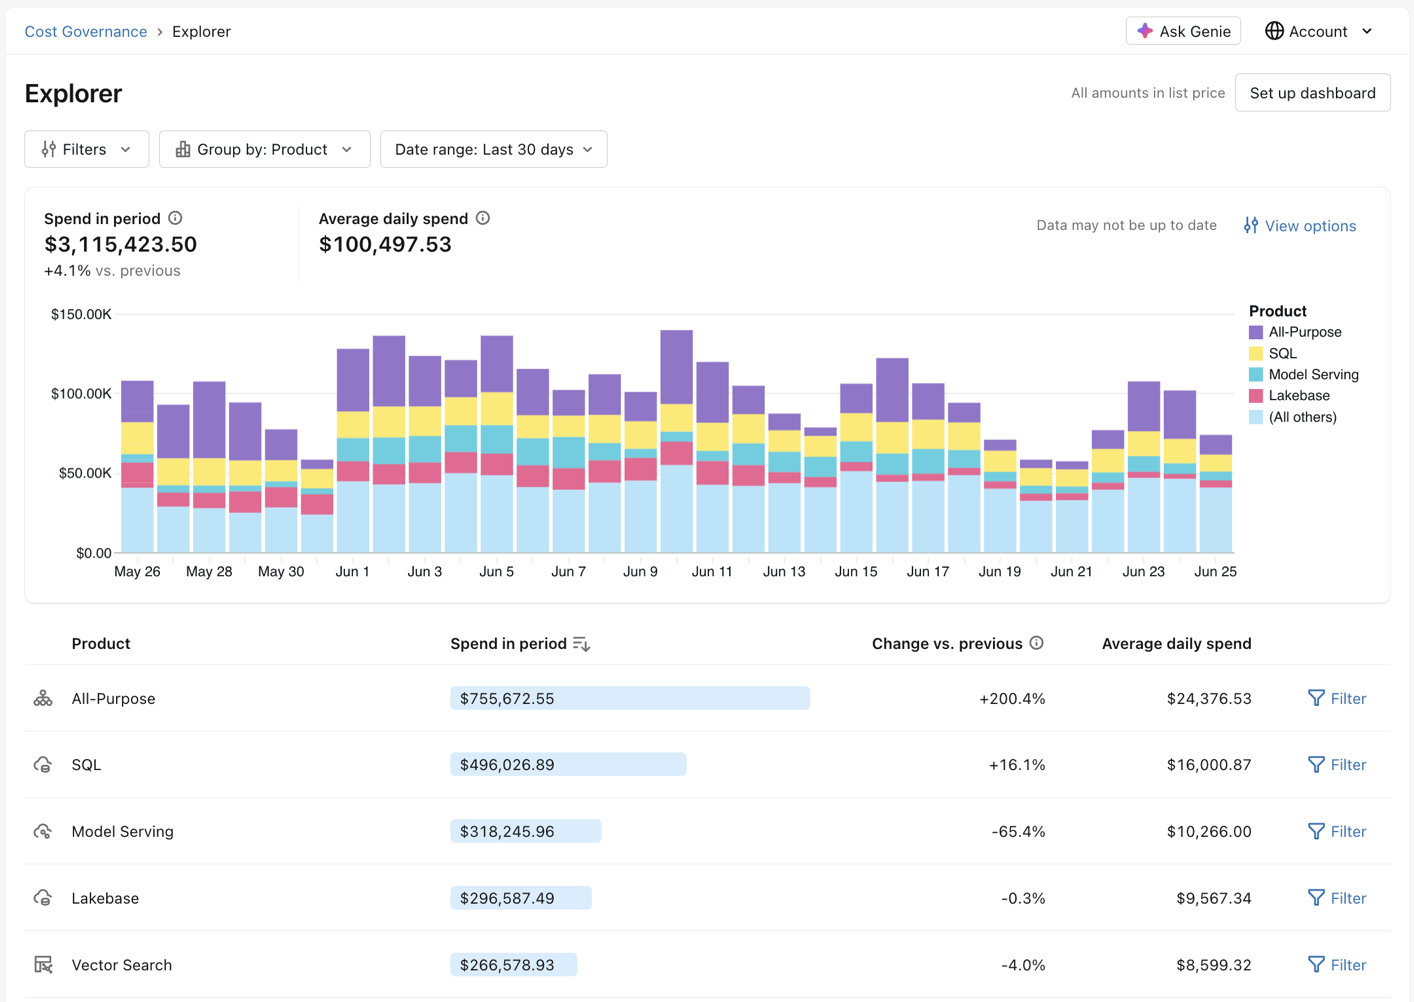
The Spend over last 30 days tile shows daily spend for the chosen scope. You can click View spend by product to open Explorer, where you can filter and group spend by product, resource, workspace, or tags. By default, data is grouped by Product over the last 30 days. For more information, see Cost management tools on Databricks.
View top spending groups
The Top groups in last 30 days tile lists the highest-spending groups for the chosen scope. Use the Product and Workspace tabs to group spend by billing product or by workspace. Click View spend by product to open the same Explorer page covered in View spend over time.
Group by resource
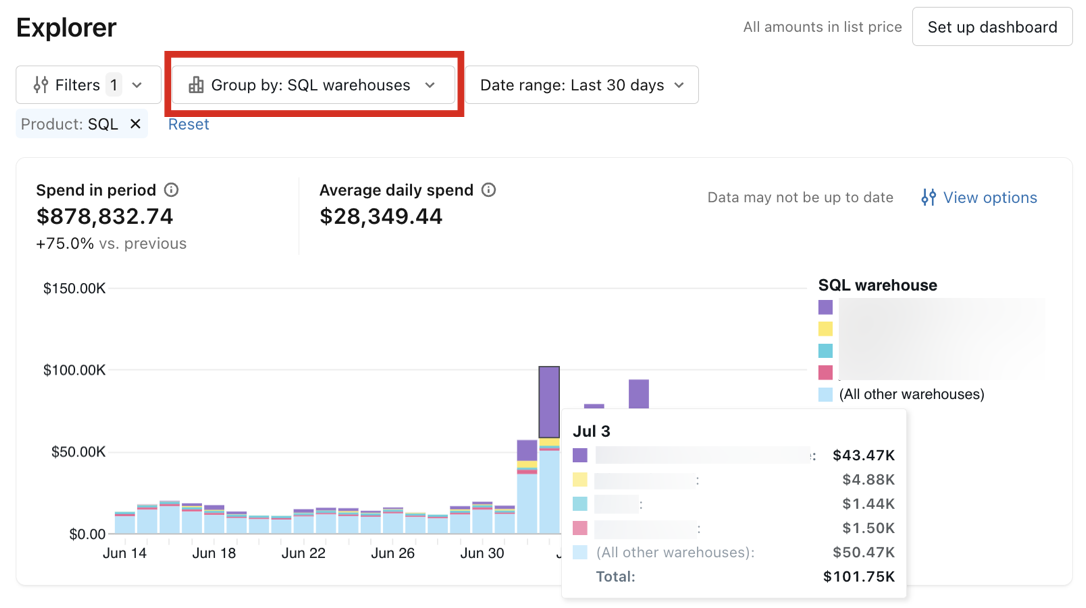
You can group spend by resource to drill down into specific billable objects within a product. Drill-downs are supported for all-purpose clusters, DLT pipelines, jobs, model serving endpoints, and SQL warehouses. To quickly filter to the top resources for a supported product, click the shortcut filter button on that product row.
View tagged and untagged spend
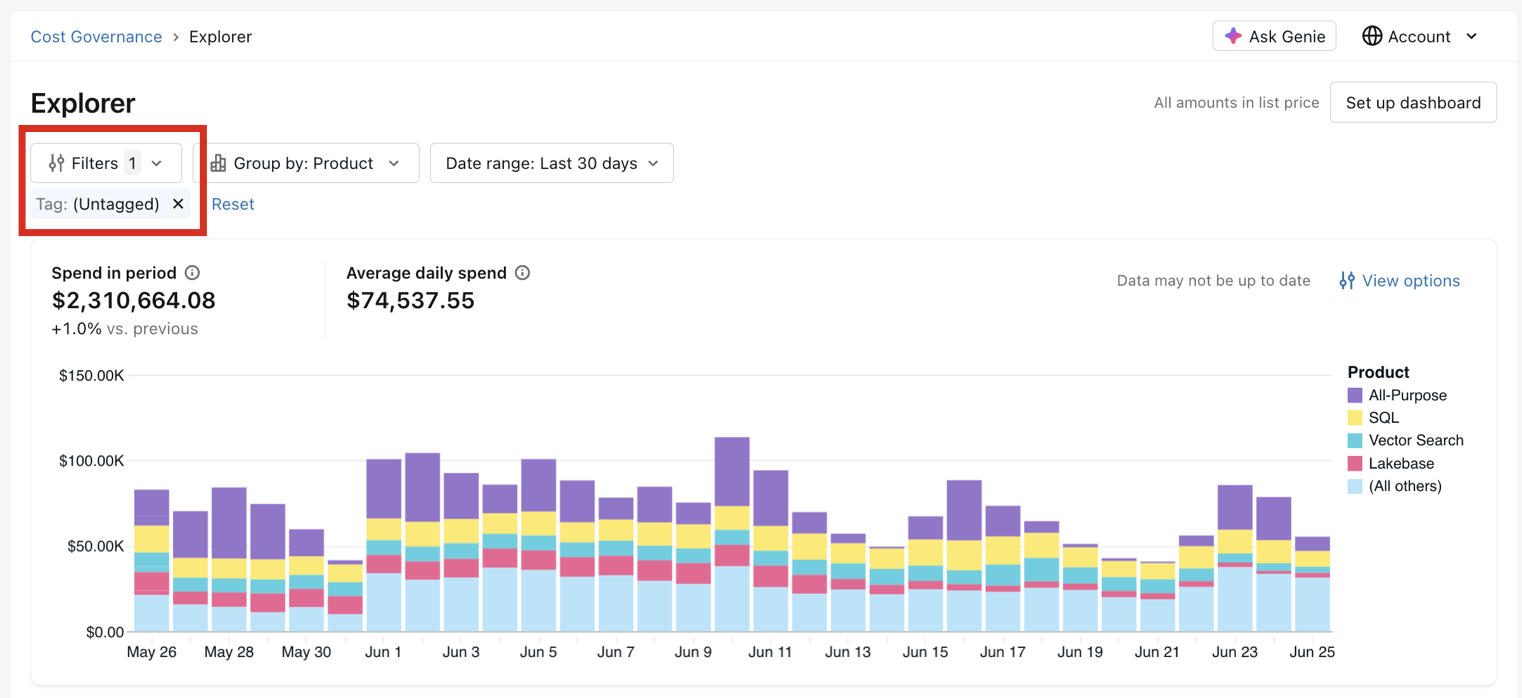
The Tagged spend tile shows the percentage of spend that is tagged in the chosen scope, compared to the previous period. You can click View untagged spend to open Explorer and identify untagged costs and the resources that need tags. By default, Databricks applies a filter that checks for untagged resources only.
Filter and group by tag
In Explorer, you can filter or group spend by tag:
- Filter by tag: Filter by a tag key to include all values for that key, or select a specific value within a tag key.
- Group by tag: Group by a tag key to break down spend across all values of that key.

View and manage budgets
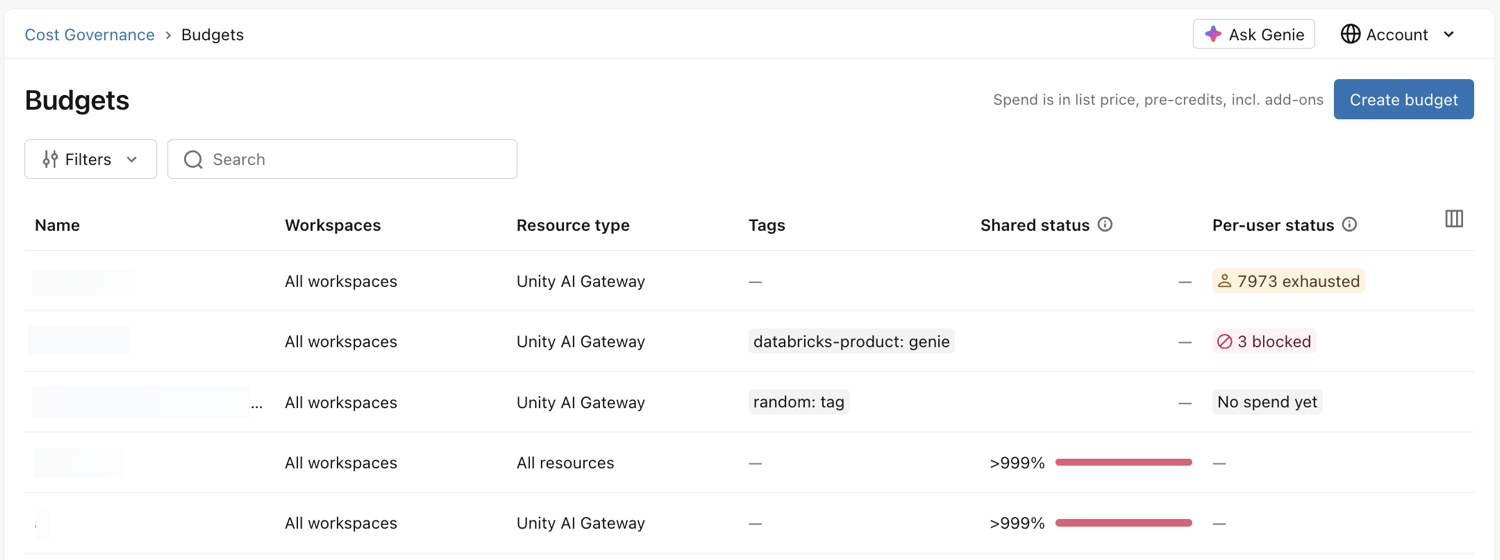
The Budgets tile shows how many budgets have exhausted their threshold out of the total in the chosen scope. Click View all budgets to review and manage budgets that track spend against thresholds.
For more information, see Create and monitor budgets.
Improve cost governance with recommendations
The Cost recommendations panel suggests actions to improve cost governance across the account. Recommendations are read-only. They might include adding tags to high-usage compute resources that are missing them. Each recommendation lists the affected resources. Click Review to see the full list of findings.