Data overview
This feature is in Beta. Account admins can enable it from the account console Previews page. See Manage Databricks previews.
In Governance Hub, the Data page provides a centralized view of data governance health across Unity Catalog. It summarizes the size of your data estate, how your data is used, and how well it is classified and maintained. Databricks also surfaces recommendations to improve governance across the account.
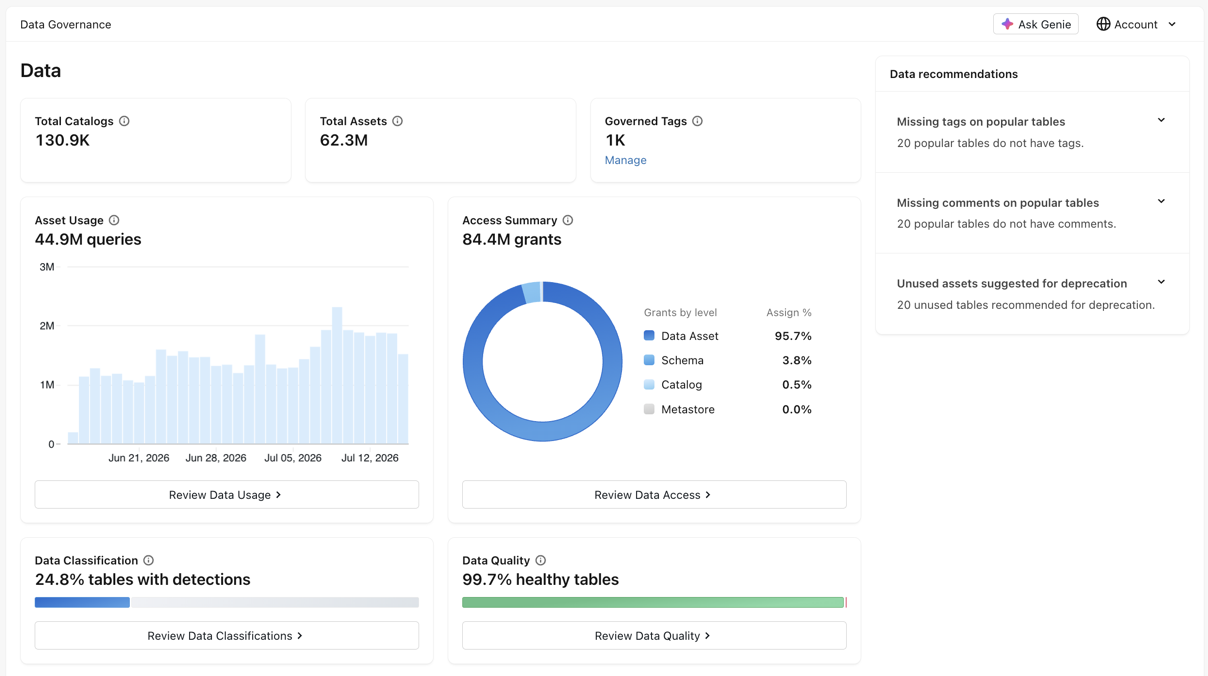
The Data page includes the following tiles:
Tile | Description |
|---|---|
Total Catalogs | The number of catalogs in scope. |
Total Assets | The number of data assets (tables, views, models, volumes, and functions) in scope. |
Governed Tags | The number of governed tags across the account. See View and manage governed tags. |
Asset Usage | The volume of queries in scope across your data estate over the last 30 days. See View data usage volume. |
Data Classification | The percentage of tables in scope with sensitive data detections. See View data classification detections. |
Data Quality | The percentage of tables in scope with data quality monitoring enabled that are healthy. See Monitor data quality. |
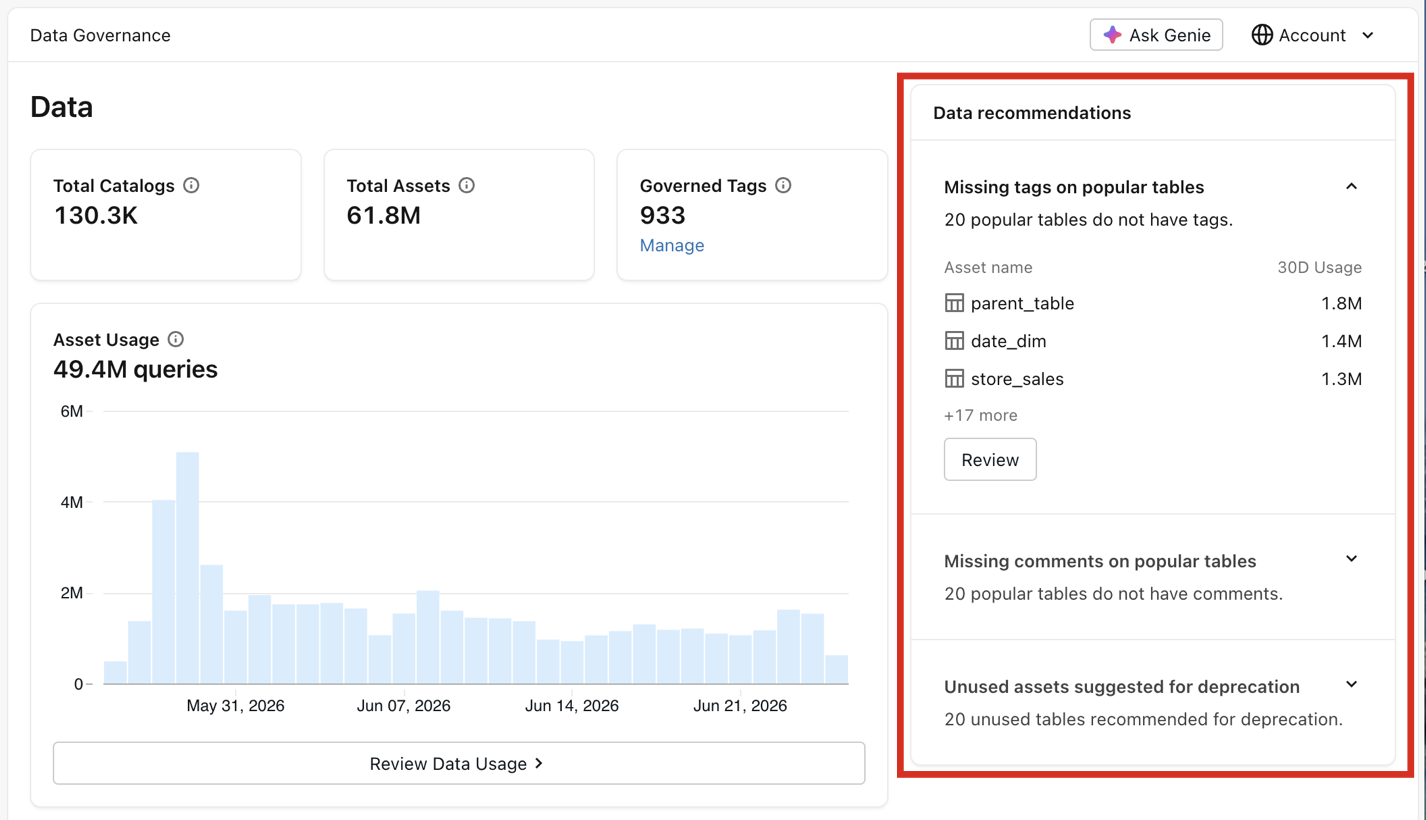
The Data recommendations panel on the right suggests actions to improve data governance across the account. See Improve data governance with recommendations.
Change the scope
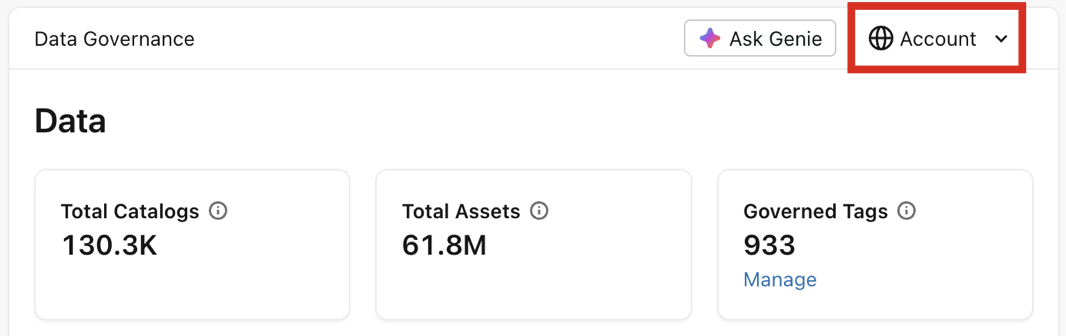
In Governance Hub, the data displayed depends on the chosen scope, which you can select in the top right corner. For account admins, this is set to  Account by default. Select a different scope, such as a metastore, to update the dashboards to reflect that scope. For more information about who can view each scope, see Access and permissions.
View and manage governed tags
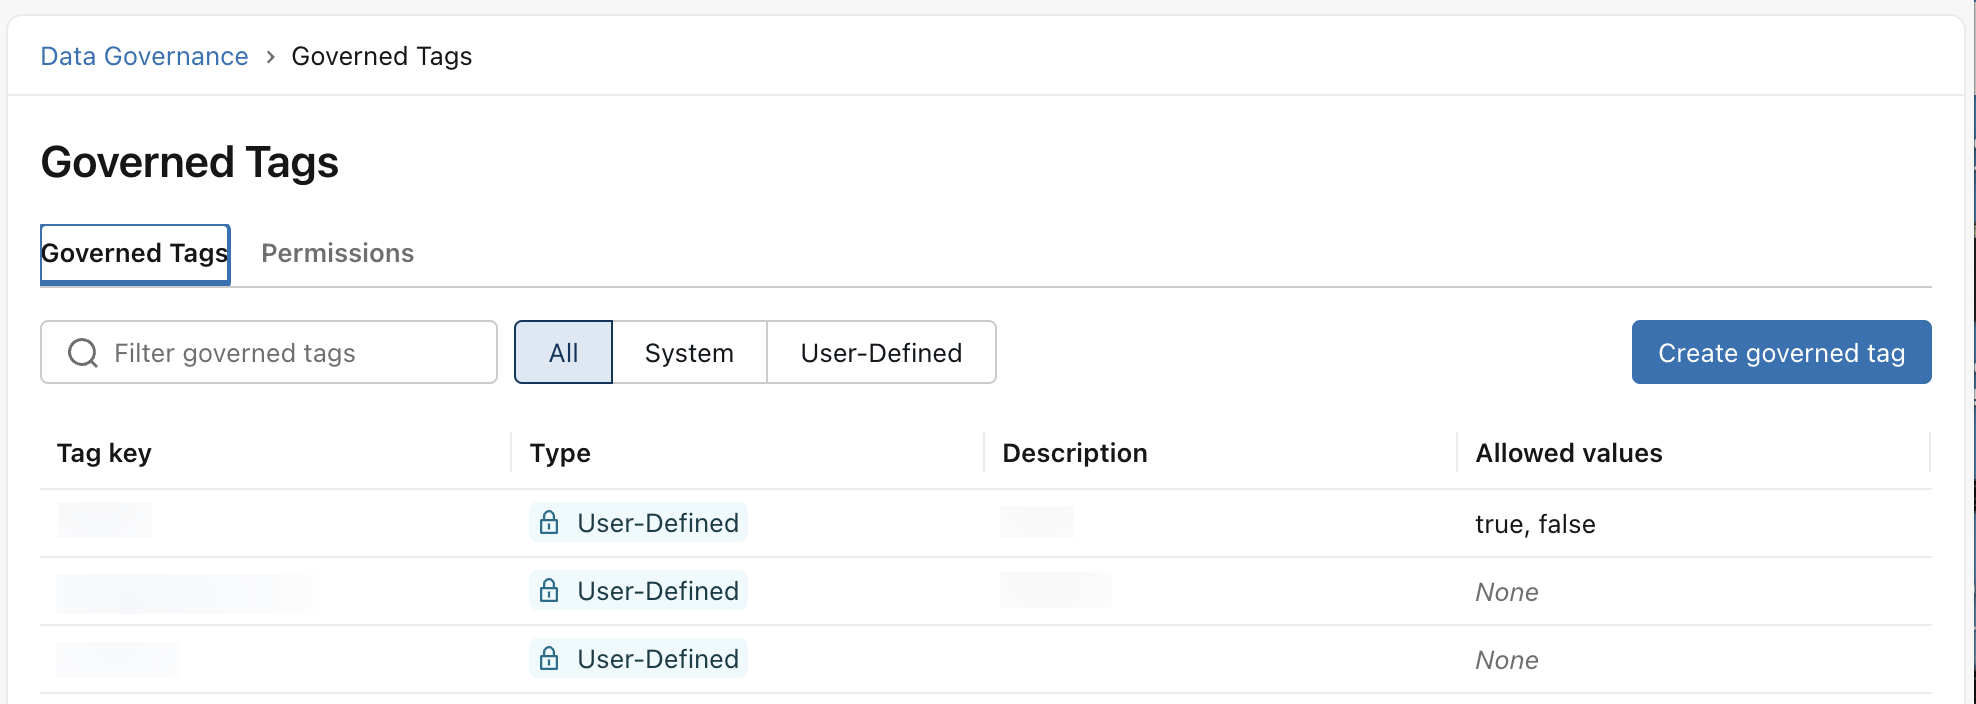
The Governed Tags tile tracks the number of governed tags across the account. You can click Manage to manage governed tags:
- In the Governed Tags tab, create new governed tags by clicking the Create governed tag button. You can also edit an existing governed tag by clicking on its tag key in the list.
- In the Permissions tab, you can grant or revoke account-level permissions that control which principals can manage governed tags and their policies.
View data usage volume
The Asset Usage tile tracks the number of queries made against data assets in the chosen scope over the last 30 days. You can click Review Data Usage for details, which opens the Data Usage page.
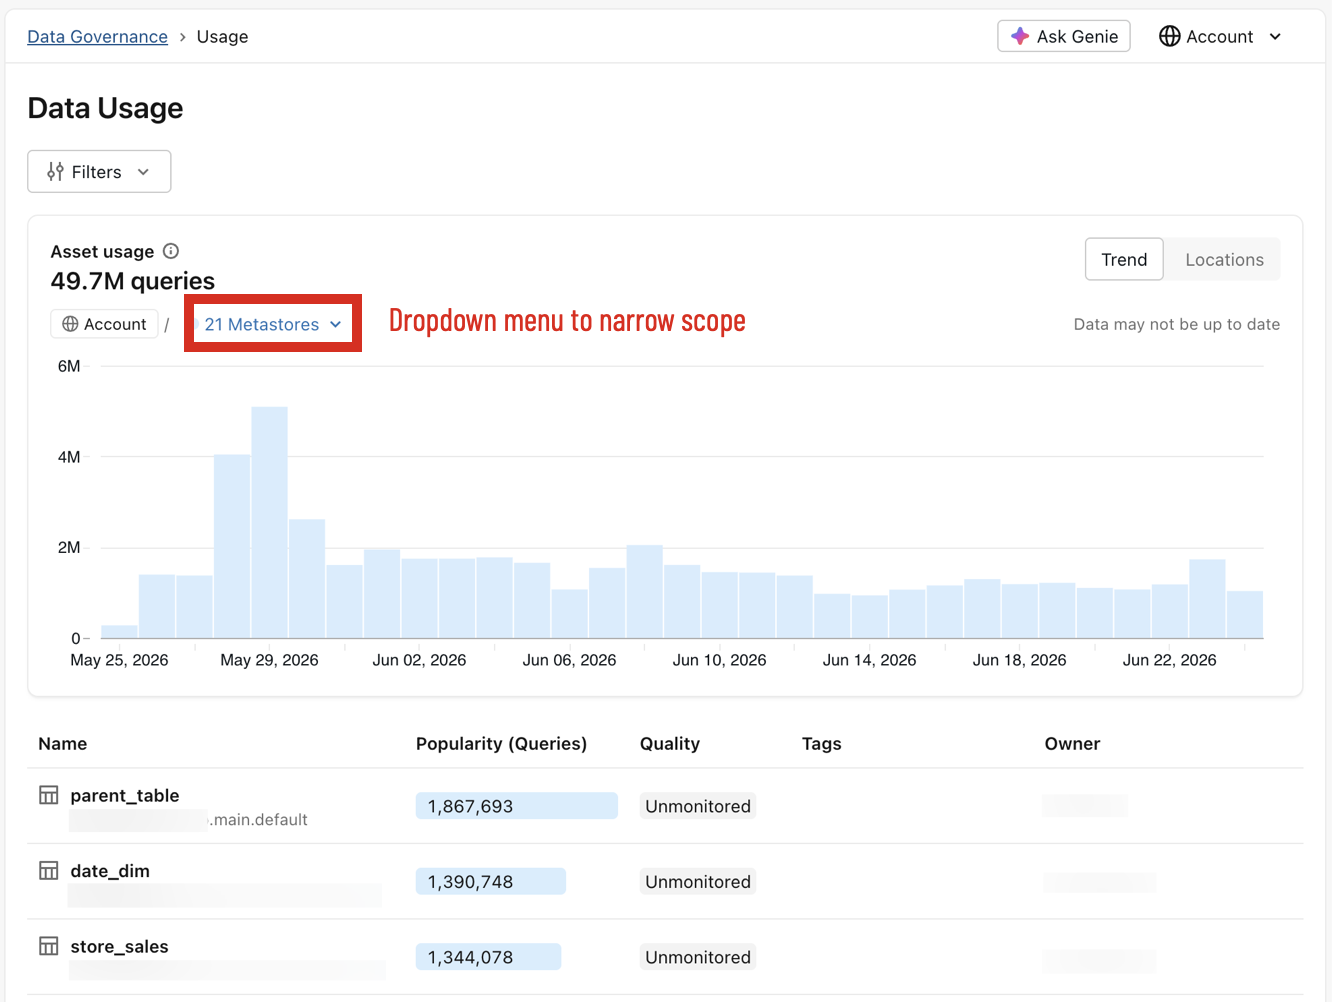
The Data Usage page contains a data visualization and a list of tables ordered by popularity. When Trend is selected for the visualization, you see a bar graph of queries made against the chosen scope. Using the dynamic dropdown menu in the top left, you can narrow down the scope to a specific metastore, catalog, and schema.
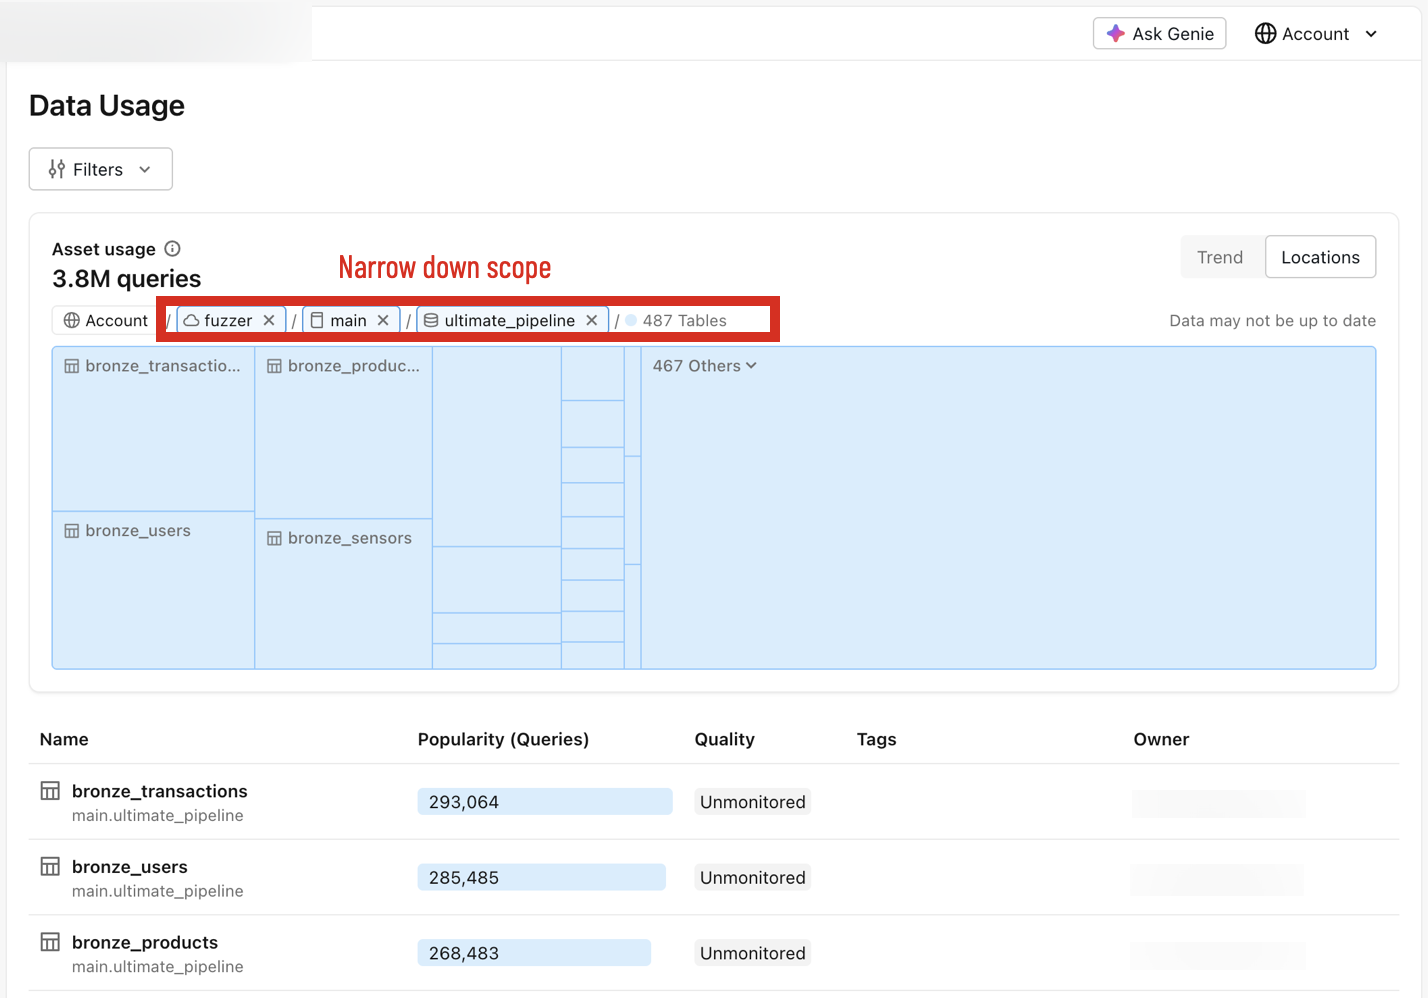
When set to Locations, you see a block chart that visualizes which metastores receive the most queries. Using the dynamic dropdown menu in the top left, you can narrow down the scope to a specific metastore, catalog, and schema.
View access insights across securable objects
The Access Summary tile tracks the number and percentage of grants made to each level of your data estate. You can click Review Data Access to open the Data Access page.
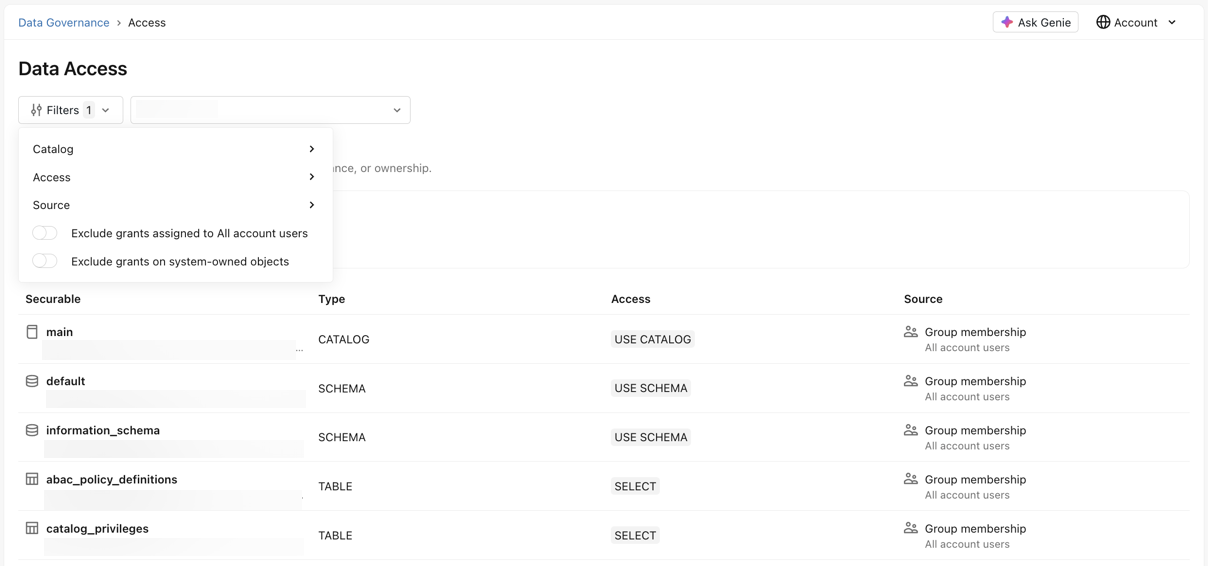
The Data Access page provides a full view of access across securable objects by principal. You can use filters to narrow your search results, examining a user's access by Catalog, Access, or Source (how they gained access). You can also change the target principal in the dropdown menu. The resulting list shows all securable objects that the selected principal can access, based on the filters.
View data classification detections
The Data Classification tile tracks, among tables where data classification is enabled, the percentage that have at least one classification detection. You can click Review Data Classifications for details, which opens the Data Classification page.
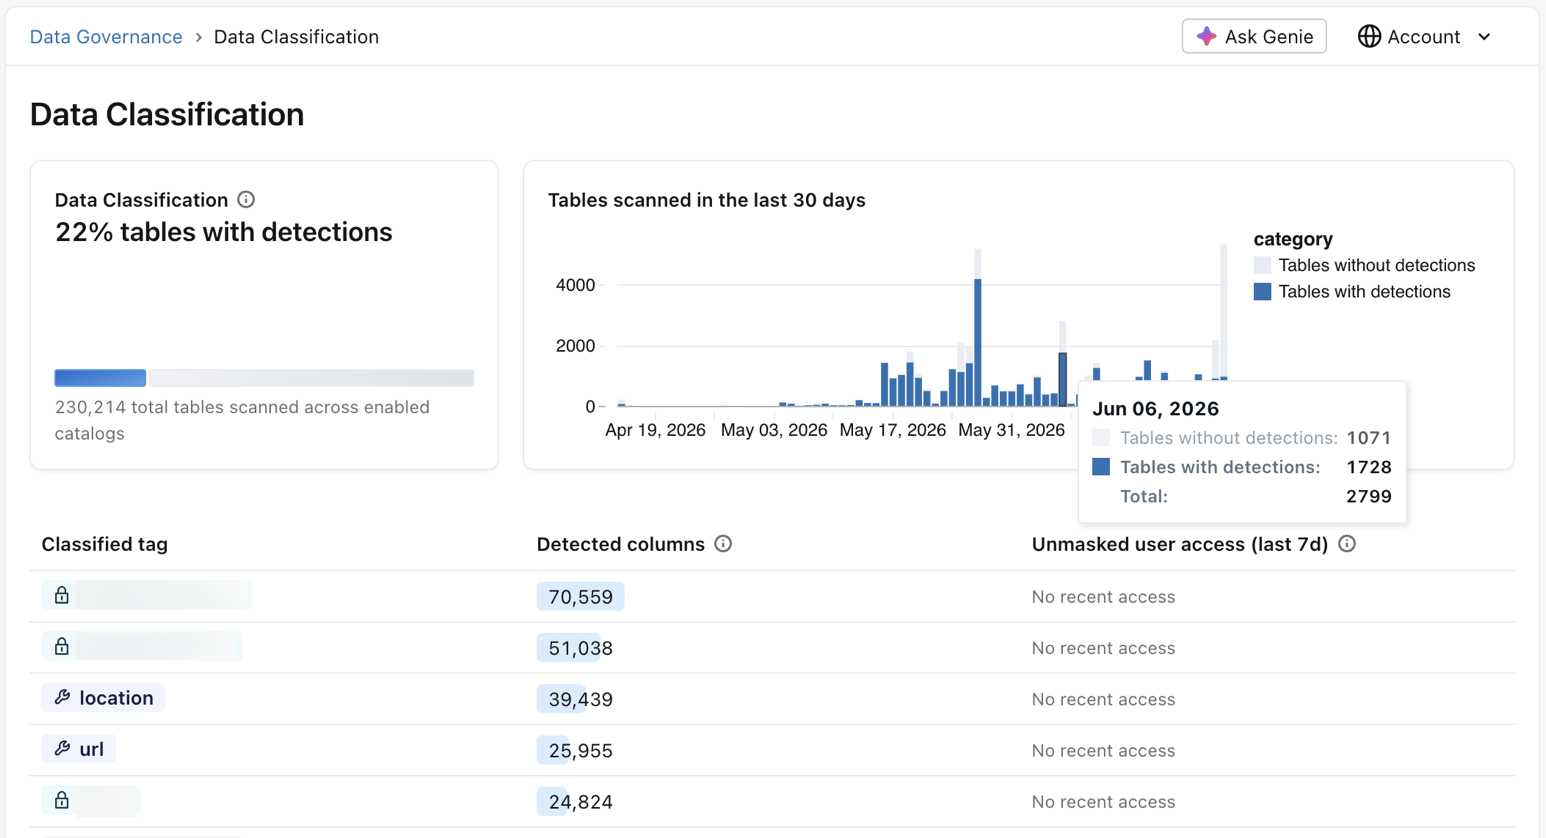
The Data Classification page contains a bar graph that visualizes table scanning process, and reports the number of tables with detections and tables without detections. This page also contains a list of the most commonly classified tags within the chosen scope, ordered by number of detected columns. Use this list to check the percentage of users who accessed the data without column masking in the last seven days. You can click on any classified tag to see additional details and get a link to the workspace to review detections.
For more information about data classification, see Data Classification.
Monitor data quality
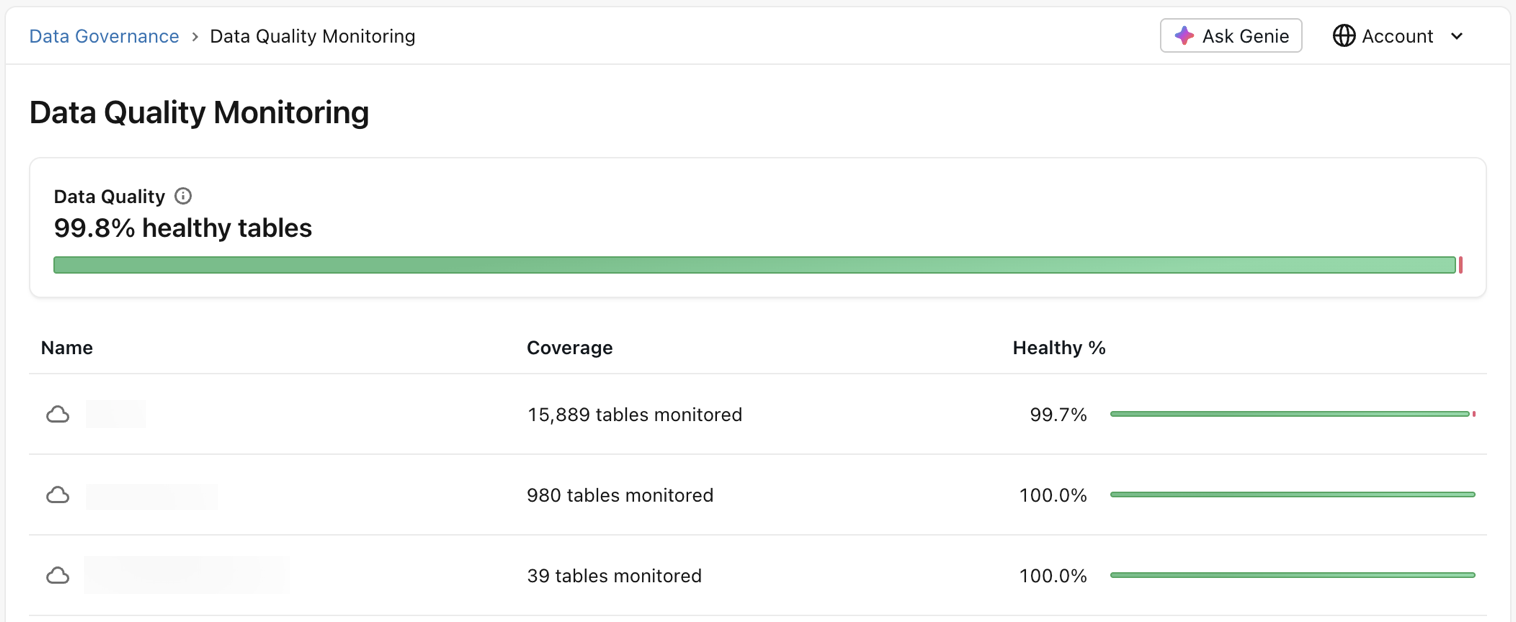
The Data Quality tile tracks the percentage of tables with a healthy status. You can click Review Data Quality for details, which opens the Data Quality Monitoring page.
The Data Quality Monitoring page lists metastores that contain unhealthy tables (where data quality monitoring is enabled), with the lowest percentages of healthy tables listed first. You can click any metastore to see additional details and get a link to the workspace to review data quality.
Improve data governance with recommendations
The Data recommendations panel suggests actions to improve data governance across the account. Recommendations are read-only. They might include missing tags on popular tables, missing comments on popular tables, and unused asssets suggested for deprecation. Each recommendation lists the affected assets and their recent usage. Click Review to see the full list of findings.