Load test your Databricks Apps agent
Load testing finds the maximum queries per second (QPS) your Databricks Apps agent can sustain before performance degrades. This page shows you how to do the following:
- Deploy a mock version of your agent to isolate infrastructure throughput from LLM latency.
- Run a ramp-to-saturation load test with Locust.
- Analyze results with an interactive dashboard.
You can follow the AI-assisted path using a Claude Code skill, or set up each step manually.
Requirements
- A Databricks workspace with Databricks Apps enabled.
- An agent app deployed (or ready to deploy) on Databricks Apps using the OpenAI Agents SDK, LangGraph, or a custom framework. See Run agents on Databricks Apps using the legacy agent server.
- The Databricks CLI installed and authenticated. See Install or update the Databricks CLI.
- Python 3.10+ with
uvpackage manager. - (For the AI-assisted path) Claude Code installed.
- (For load tests longer than ~1 hour) A service principal with M2M OAuth credentials (
client_idandclient_secret). See Authorize service principal access to Databricks with OAuth.- For short load tests (less than ~1 hour), your existing user (U2M) OAuth credentials from
databricks auth loginwork fine. For longer tests, use M2M OAuth with a Databricks service principal — U2M tokens expire during long runs and cause mid-test failures. Creating a Databricks service principal requires workspace admin access.
- For short load tests (less than ~1 hour), your existing user (U2M) OAuth credentials from
AI-assisted setup (recommended)
If you use Claude Code, the /load-testing skill automates the workflow. It reads your agent code, generates a mock, creates load testing scripts, and walks you through deployment.
Tell Claude Code to do it for you:
Clone https://github.com/databricks/app-templates and run the /load-testing skill against the {your-template} template.
Or follow the steps below.
Step 1: Clone an agent template
The /load-testing skill is included in the databricks/app-templates repository, both as the top-level agent-load-testing skill and pre-synced into every individual agent template. If you already have a project from app-templates, you already have the skill.
Clone the repo and change into the template directory for the agent you want to load test:
git clone https://github.com/databricks/app-templates.git
cd app-templates/{your-template}
Step 2: Run the load testing skill
In Claude Code, run:
/load-testing
The skill interactively walks you through the following steps. You can skip mocking to test your real agent, or skip deployment if your apps are already running.
- Gathering parameters: asks about your deployment status, compute sizes, worker configurations, and OAuth credentials.
- Creating load test scripts: generates
locustfile.py,run_load_test.py, anddashboard_template.pytailored to your project. - Mocking your LLM: creates a mock client specific to your SDK (OpenAI Agents SDK, LangGraph, or custom) that replaces real LLM calls with configurable streaming delays.
- Deploying test apps: guides you through deploying multiple app configurations with different compute sizes and worker counts.
- Running tests: executes the load test with M2M OAuth authentication and ramp-to-saturation.
- Generating results: produces an interactive HTML dashboard with QPS, latency, and failure metrics.
Manual setup
Follow these steps to set up and run load tests without AI assistance.
Step 1: Mock your agent's LLM calls (optional)
Skip this step if you want end-to-end results that include real LLM latency. To measure Databricks Apps infrastructure throughput in isolation, mock the LLM so its per-request latency (typically 1-30 seconds) doesn't become the bottleneck.
A mock returns canned responses with a configurable streaming delay, preserving the full request/response pipeline (SSE streaming, tool dispatch, SDK runner) and swapping out only the LLM. This surfaces the maximum QPS the Databricks Apps platform can deliver and avoids Foundation Model API token costs during load tests.
The mock timing is controlled by two environment variables:
Variable | Default | Description |
|---|---|---|
|
| Delay in milliseconds between streamed text chunks |
|
| Number of text chunks per response |
With the defaults, each mock response takes approximately 800 ms (10 ms x 80 chunks), significantly faster than a real LLM response (3-15 seconds). Throughput numbers then reflect the platform, not the model.
Create a mock client that replaces the real LLM client. The rest of your agent code stays unchanged, and the approach depends on your SDK. For OpenAI, see the mock_openai_client.py reference implementation in databricks/app-templates. The same pattern adapts to other SDKs.
- OpenAI Agents SDK
- LangGraph
- Custom agents
Create agent_server/mock_openai_client.py — a MockAsyncOpenAI class that implements chat.completions.create() with streaming. It returns tool call chunks instantly (simulating the LLM deciding to call a tool) and text response chunks with configurable delay from MOCK_CHUNK_DELAY_MS and MOCK_CHUNK_COUNT environment variables.
Swap it into your agent:
from agent_server.mock_openai_client import MockAsyncOpenAI
from agents import set_default_openai_client, set_default_openai_api

set_default_openai_client(MockAsyncOpenAI())
set_default_openai_api("chat_completions")
The rest of your agent code (handlers, tools, streaming logic) stays unchanged.
Replace the ChatDatabricks model with a mock that returns pre-built AIMessage objects:
# Before:
# model = ChatDatabricks(endpoint="databricks-claude-sonnet-4-6")

# After:
from agent_server.mock_llm import MockChatModel
model = MockChatModel()
The mock should return AIMessage objects with tool calls on the first invocation and text content on subsequent invocations, with configurable streaming delays.
Wrap whatever external API calls your agent makes (LLM, AI Search, tool APIs) with mock implementations that return realistic response shapes with configurable delays.
Step 2: Set up load testing scripts
Create a load-test-scripts/ directory in your project. The load testing framework consists of three scripts that are framework-agnostic and work with any Databricks Apps agent.
<project-root>/
  agent_server/                  # Your existing agent code
  load-test-scripts/             # Load testing scripts (create this)
    run_load_test.py             #   CLI orchestrator
    locustfile.py                #   Locust test with SSE streaming + TTFT tracking
    dashboard_template.py        #   Interactive HTML dashboard generator
  load-test-runs/                # Results (auto-created per run)
    <run-name>/
      dashboard.html             #   Interactive dashboard
      test_config.json           #   Test parameters for reproducibility
      <label>/                   #   Per-config Locust CSV output
The framework includes the following files:
locustfile.py: A Locust load test that sendsPOST /invocationsrequests withstream: true, parses SSE streams, tracks time to first token (TTFT) as a custom metric, uses M2M OAuth token exchange with auto-refresh, and implements aStepRampShapethat ramps users fromstep_sizetomax_userswhile holding each level forstep_durationseconds.run_load_test.py: A CLI orchestrator that tests each app URL sequentially with isolated metrics per configuration. It handles OAuth token refresh, runs a healthcheck and warmup before each test, and saves results toload-test-runs/<run-name>/<label>/.dashboard_template.py: Generates a self-contained HTML dashboard using Chart.js with KPI cards, bar charts (QPS, latency, TTFT by config), QPS ramp progression line charts, and a full results table. Can be run standalone:uv run dashboard_template.py ../load-test-runs/<run-name>/.
Install dependencies
The load testing scripts use their own pyproject.toml inside load-test-scripts/ to avoid polluting your agent's production dependencies. Create load-test-scripts/pyproject.toml:
[project]
name = "load-test-scripts"
version = "0.1.0"
requires-python = ">=3.10"
dependencies = [
  "locust>=2.32,<2.40",
  "urllib3<2.3",
  "requests",
]
Pin locust to <2.40. Newer versions (>=2.43) have a known RecursionError that breaks long load tests.
Install from within the load-test-scripts/ directory:
cd load-test-scripts/
uv sync
Step 3: Deploy test apps with varying configurations
Deploy multiple Databricks Apps with different compute sizes and worker counts to find the optimal configuration for your workload.
Recommended test matrix
The configurations below focus on the sweet spot identified from prior testing. If you want broader coverage, add one config on either side (for example, medium-w1 or large-w12), but the six below are usually enough.
Compute size | Workers | Suggested app name |
|---|---|---|
Medium | 2 |
|
Medium | 3 |
|
Medium | 4 |
|
Large | 6 |
|
Large | 8 |
|
Large | 10 |
|
Configure compute size
Use the Databricks CLI to set compute size when creating or updating an app:
# Create a new app with Medium compute
databricks apps create <app-name> --compute-size MEDIUM

# Update an existing app to Large compute
databricks apps update <app-name> --compute-size LARGE
Configure worker count with Declarative Automation Bundles
start-server (via AgentServer.run()) accepts a --workers flag directly. Pass the worker count in the command array using a DAB variable:
variables:
  app_name:
    default: 'my-agent-medium-w2'
  workers:
    default: '2'

resources:
  apps:
    load_test_app:
      name: ${var.app_name}
      source_code_path: .
      config:
        command: ['uv', 'run', 'start-server', '--workers', '${var.workers}']
        env:
          - name: MOCK_CHUNK_DELAY_MS
            value: '10'
          - name: MOCK_CHUNK_COUNT
            value: '80'

targets:
  medium-w2:
    default: true
    variables:
      app_name: 'my-agent-medium-w2'
      workers: '2'
  large-w8:
    variables:
      app_name: 'my-agent-large-w8'
      workers: '8'
Deploy and verify
Deploy each target with the Databricks CLI:
databricks bundle deploy --target medium-w2
databricks bundle run load_test_app --target medium-w2
Verify that apps are active before running load tests:
databricks apps get <app-name> --output json | jq '{app_status, compute_status, url}'
Wait for all apps to reach ACTIVE status before proceeding. Apps that are still starting produce misleading results.
Step 4: Run load tests
Set up authentication
Select your authentication based on how long you plan to run:
- Short tests (less than ~1 hour): use your existing user credentials from
databricks auth login. No extra setup required. - Long tests (more than ~1 hour, such as overnight runs): use M2M OAuth with a Databricks service principal. U2M tokens expire and break your test mid-run. Creating a Databricks service principal requires workspace admin access.
For M2M OAuth, export the Databricks service principal credentials before running tests:
export DATABRICKS_HOST=https://your-workspace.cloud.databricks.com
export DATABRICKS_CLIENT_ID=<your-client-id>
export DATABRICKS_CLIENT_SECRET=<your-client-secret>
Parameters reference
Parameter | Required | Default | Description |
|---|---|---|---|
| Yes | — | App URL(s) to test (repeatable) |
| For long tests |
| Service principal client ID (M2M OAuth) |
| For long tests |
| Service principal client secret (M2M OAuth) |
| No | Auto-derived from URL | Human-readable label per app (repeatable) |
| No | Auto-detected or | Compute size tag per app: |
| No |
| Maximum concurrent simulated users |
| No |
| Users added per ramp step |
| No |
| Seconds per ramp step |
| No |
| User spawn rate (users/sec) |
| No |
| Name for this run — results saved to |
| No | Off | Generate interactive HTML dashboard after tests complete |
Example commands
Quick single-app test (short run — uses your databricks auth login session):
cd load-test-scripts/

uv run run_load_test.py \
    --app-url https://my-app.aws.databricksapps.com \
    --dashboard --run-name quick-test
Full matrix across the recommended 6 configurations (long run — pass M2M credentials). Pass --compute-size flags in the same order as --app-url:
uv run run_load_test.py \
    --app-url https://my-app-medium-w2.aws.databricksapps.com \
    --app-url https://my-app-medium-w3.aws.databricksapps.com \
    --app-url https://my-app-medium-w4.aws.databricksapps.com \
    --app-url https://my-app-large-w6.aws.databricksapps.com \
    --app-url https://my-app-large-w8.aws.databricksapps.com \
    --app-url https://my-app-large-w10.aws.databricksapps.com \
    --compute-size medium --compute-size medium --compute-size medium \
    --compute-size large --compute-size large --compute-size large \
    --client-id $DATABRICKS_CLIENT_ID \
    --client-secret $DATABRICKS_CLIENT_SECRET \
    --dashboard --run-name overnight-sweep
Multiple runs for statistical consistency:
for RUN in r1 r2 r3 r4 r5; do
  uv run run_load_test.py \
      --app-url https://my-app.aws.databricksapps.com \
      --client-id $DATABRICKS_CLIENT_ID \
      --client-secret $DATABRICKS_CLIENT_SECRET \
      --max-users 1000 --step-size 20 --step-duration 10 \
      --run-name my_test_${RUN} --dashboard || break
done
What happens during a run
- Healthcheck: verifies the app streams correctly (receives
[DONE]). - Warmup: sends sequential requests to warm up the app.
- Ramp-to-saturation: steps up concurrent users every
step_durationseconds. - Saturation detection: when QPS plateaus despite adding more users, you've hit the throughput ceiling.
Estimated duration
Each app under test runs through its own ramp, so total run time scales with the number of configurations in your matrix. Use the formula below to plan your run window.
Duration per app: (max_users / step_size) * step_duration seconds.
With defaults (--max-users 300 --step-size 20 --step-duration 30):
- 15 steps x 30 seconds = approximately 7.5 minutes per app
- For the recommended 6-configuration matrix: approximately 45 minutes per run
Step 5: View and interpret results
-
Open the dashboard:
Bashopen load-test-runs/<run-name>/dashboard.html -
(Optional) Regenerate the dashboard from existing data, for example after updating the template:
Bashcd load-test-scripts/
uv run dashboard_template.py ../load-test-runs/<run-name>/
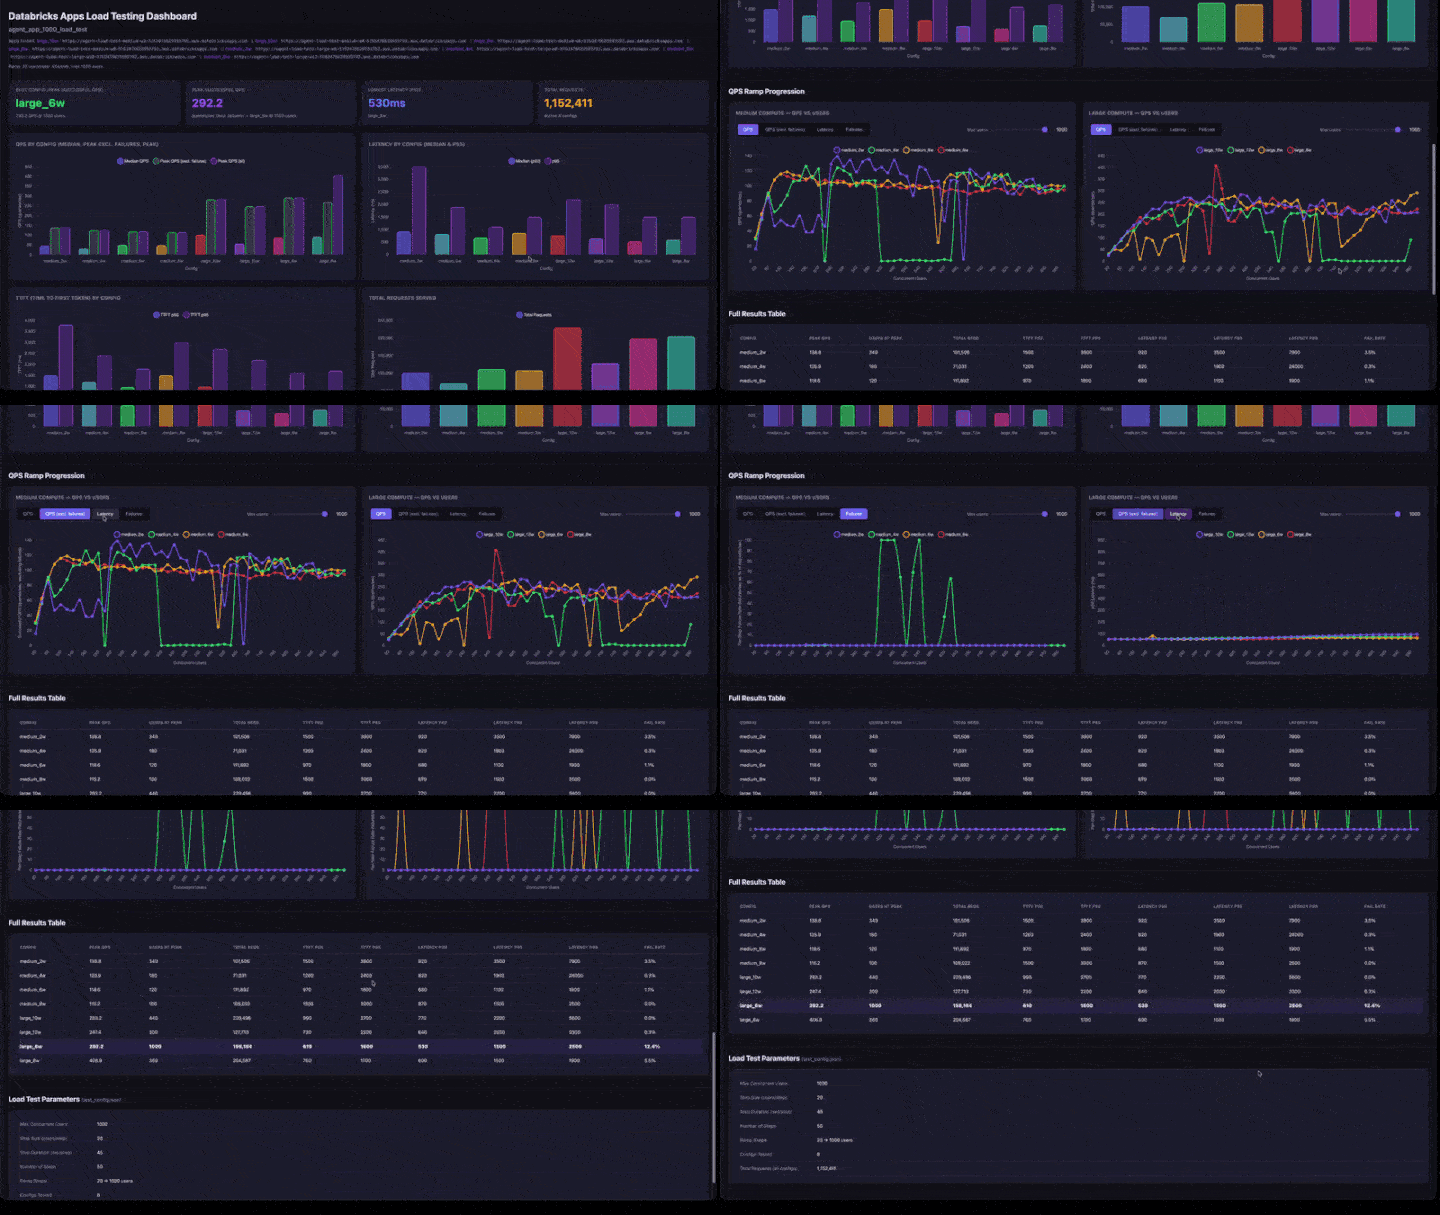
Dashboard sections
The interactive dashboard includes:
- KPI cards: best configuration (by peak successful QPS), overall peak QPS, lowest latency, and total requests served.
- QPS by Config: grouped bar chart showing median QPS, peak QPS excluding failures, and peak QPS side-by-side for each configuration.
- Latency by Config: grouped bars showing p50 and p95 latency.
- TTFT by Config: time to first token (p50 and p95).
- Total Requests Served: request count per configuration.
- QPS Ramp Progression: line charts with tabs for QPS, QPS (excluding failures), Latency, and Failures. Includes a max-users slider to zoom into lower concurrency ranges. Charts are grouped by compute size (medium and large side-by-side).
- Full Results Table: all configurations with peak QPS, users at peak, latency percentiles, and failure rate.
- Test Parameters: configuration summary for reproducibility.
How to interpret results
- Peak QPS: the maximum QPS achieved at any ramp step. This is the throughput ceiling for that configuration.
- Users at Peak: the number of concurrent users when peak QPS was achieved. Adding more users beyond this point does not increase throughput.
- Failure Rate: should be 0% or very low. A high failure rate means the app is overloaded at that concurrency level.
- QPS Ramp Chart: look for where the line flattens. That's the saturation point: adding more users won't increase throughput.
Benchmark reference run on synthetic data
This section reports what an internal Databricks benchmark run measured against a synthetic agent app, where every LLM call was mocked. It's a separate exercise from load testing your own agent: use it to see the shape of results you can expect and to get a rough starting point for sizing.
What this run showed
- Recommended starting point: 2 workers on Medium compute, or 8 workers on Large.
- More workers isn't always better. On Medium, 2 workers (155.1 QPS) beat 4 workers (116.5 QPS) by ~33%. The mock workload is CPU-bound, so past 2 workers you hit CPU/memory contention that cancels out the extra parallelism. A real IO-bound agent that mostly waits on a model endpoint may scale further than this mock, so be sure to test your own agent.
- Compute size: Large delivered roughly 2.2x the throughput of Medium (278.0 vs 123.5 avg peak QPS).
- Latency: Large ran ~20% lower than Medium (~906 ms vs 1,180 ms p50), with TTFT ~1,100 ms on Large vs 1,720-1,820 ms on Medium.
- Reliability: the failure rate stayed at or near 0% for every configuration, even at 1,000 concurrent users.
Because the LLM was mocked (streaming simulated with fixed per-chunk delays), these are infrastructure-throughput numbers rather than end-to-end agent numbers. They measure how many requests the Databricks Apps FastAPI AgentServer can process in parallel, not the latency of a real model. A production agent that calls a live LLM endpoint sees lower QPS and higher latency, dominated by model response time. Your own numbers vary with agent complexity, payload size, tool calls, region, and the model endpoint you call. For accurate sizing, run a load test against your own agent.
The tabled results below show the full per-configuration breakdown.
Test conditions
- Reference run: 5 identical rounds against 8 app configurations (4 Medium, 4 Large compute), each with a different uvicorn worker count.
- Ramp: 20 to 1,000 concurrent users, in steps of 20 users held for 10 seconds each (50 steps per configuration).
- Mock agent: streaming responses of roughly 95 chunks per request, simulating LLM token streaming.
- Volume: about 1.46 million total requests across all runs.
Peak QPS by configuration
Peak QPS is averaged across the 5 runs.
Compute size | Workers | Avg peak QPS | Peak range | Failure rate |
|---|---|---|---|---|
Medium | 2 | 155.1 | 137.0-166.6 | 0.0% |
Medium | 4 | 116.5 | 112.6-121.8 | 0.1% |
Medium | 6 | 111.9 | 102.6-117.5 | 0.0% |
Medium | 8 | 110.3 | 108.3-112.1 | 0.0% |
Large | 6 | 281.6 | 268.2-292.4 | 0.0% |
Large | 8 | 268.2 | 265.8-271.0 | 0.0% |
Large | 10 | 288.1 | 280.3-299.4 | 0.0% |
Large | 12 | 274.2 | 269.4-278.8 | 0.0% |
Averaged by compute size:
Compute size | Avg peak QPS | Avg QPS |
|---|---|---|
Medium | 123.5 | 45.5 |
Large | 278.0 | 100.1 |
In this run, Large compute delivered roughly 2.2x the throughput of Medium compute.
Troubleshooting
Issue | Solution |
|---|---|
Auth token expired mid-test | For tests longer than ~1 hour, switch from U2M to M2M OAuth by passing |
Healthcheck fails | Verify the app is ACTIVE: |
0 QPS or no results | Check |
Low QPS despite high user count | The app is saturated. Try more workers or larger compute. |
High failure rate | The app is overloaded. Reduce |
Dashboard shows no ramp data | Verify |
Additional resources
- Test with real LLM calls: skip the mocking step and deploy your actual agent to measure end-to-end latency including LLM response time.
- Tune worker count: use the test matrix results to find the optimal worker count for your compute size.
- Tutorial: Evaluate and improve an agent to measure accuracy, relevance, and safety alongside throughput.
- Productionize your Databricks Apps agent for the full production-readiness sequence, including AI Gateway.