Monitor all AI activity using the unified trace table
The unified trace table is in Beta. Unity Gateway is generally available, but its beta capabilities are enabled separately. An account admin must turn on the Enhanced Unity Gateway beta features from the account console Previews page. See Manage Databricks previews.
The unified trace table gives you a single place to monitor, debug, secure, and audit all activity across your Unity Gateway services.
A metastore admin sets up unified tracing once. After that, all Unity Gateway traffic is automatically logged with no per-endpoint setup.
By default, only the metastore admin who creates the trace table can read it. No other users — including endpoint owners and security teams — can query the table until the owner explicitly grants access via Unity Catalog. See Permissions and access control.
Requirements
- Enhanced Unity Gateway preview enabled for your account. See Manage Databricks previews.
- Unity Catalog enabled for your workspace.
- Metastore admin role to set up unified tracing.
CREATE TABLE,USE CATALOG, andUSE SCHEMApermissions in the target Unity Catalog catalog and schema.- To query the table:
SELECTprivilege on the trace table. By default, only the metastore admin can query it. To grant access to others, see Permissions and access control.
To use a catalog backed by default storage, a workspace admin must enable Zerobus Ingest Default Storage in Settings > Previews. See Manage Databricks previews.
What is the unified trace table?
The unified trace table captures every request and response across all Unity Gateway services into one Unity Catalog table in OpenTelemetry ("OTel") format. It provides three advantages over inference tables:
- Complete. All activity across every service lands in one place, with no per-endpoint setup required.
- Enforceable. A metastore admin creates the table once, and logging is applied across all services with no blind spots from services that have logging disabled.
- Open. Built on the OpenTelemetry standard, so any tool can consume the data directly without custom post-processing.
Common uses:
- Debugging: Filter by
trace_idto replay every step of a failed agent run. Filter byservice_nameandstatus.codeto find all errors on a specific endpoint. - Analytics for AI usage: Use AI functions to analyze interactions with LLMs (including coding assistants) to capture patterns across callers and understand the value AI provides in your org.
- Reduce token usage: Use AI functions to analyze common error patterns in calls to LLMs or MCPs and understand how to improve the effectiveness of agents and coding assistants.
- Security and compliance: Every span records the requester identity, endpoint name, and full request payload, so you can feed it into your security tooling for threat detection and investigation.
- Auditability: Review AI activity for a user, endpoint, or time range.
Trace delivery is best-effort (see Limitations), so the unified trace table complements rather than replaces the Databricks audit logs. Continue to use audit logs as the system of record for compliance.
Unified trace table vs. inference tables
The unified trace table is the recommended approach for new deployments. Inference tables remain available but are designed for single model-service endpoint, request/response monitoring only. For more on inference tables, see Log requests and responses to inference tables.
Unified trace table | Inference tables | |
|---|---|---|
Scope | All Unity Gateway model services and MCP services, in one table | Per model serving endpoint, one table each |
Setup | One-time setup by metastore admin; applies to all services across all workspaces attached to the metastore | Must be enabled per endpoint |
Schema | OpenTelemetry spans | Databricks-specific (requires post-processing) |
Agentic workflows | All hops land in one table; shared trace IDs to reconstruct a full multi-hop trace are coming soon | Fragmented across per-endpoint tables |
MLflow compatibility | Spans use MLflow-compatible OTel schema that MLflow tools can read directly | Requires manual trace extraction |
Owner | Metastore admin who creates the table | Endpoint owner |
Access control | Default: metastore admins only. Grant others access with Unity Catalog permissions plus ABAC row filter policies | Separate Unity Catalog ACLs per endpoint |
Enable the unified trace table
This is a one-time operation performed by a metastore admin. The table lives at a Unity Catalog path you choose (for example, <catalog>.<schema>.unity_gateway_otel_spans).
Store the trace table in a dedicated catalog or schema. Isolation prevents permissions from other catalogs or schemas from unintentionally exposing trace data. The metastore admin who creates the table becomes its owner and controls who can access it. To grant query access to other users, we recommend setting up ABAC as documented at Permissions and access control.
- In the workspace sidebar, click AI Gateway.
- Click Govern > Traces > Set up tracing.
- Select the catalog and schema where the trace table will be created.
- Click Save to create the trace table.
Consume the unified trace table
By default, only the metastore admin can query the trace table. Before sharing it, set up an ABAC row filter policy so each user sees only the traces they should. See Permissions and access control below.
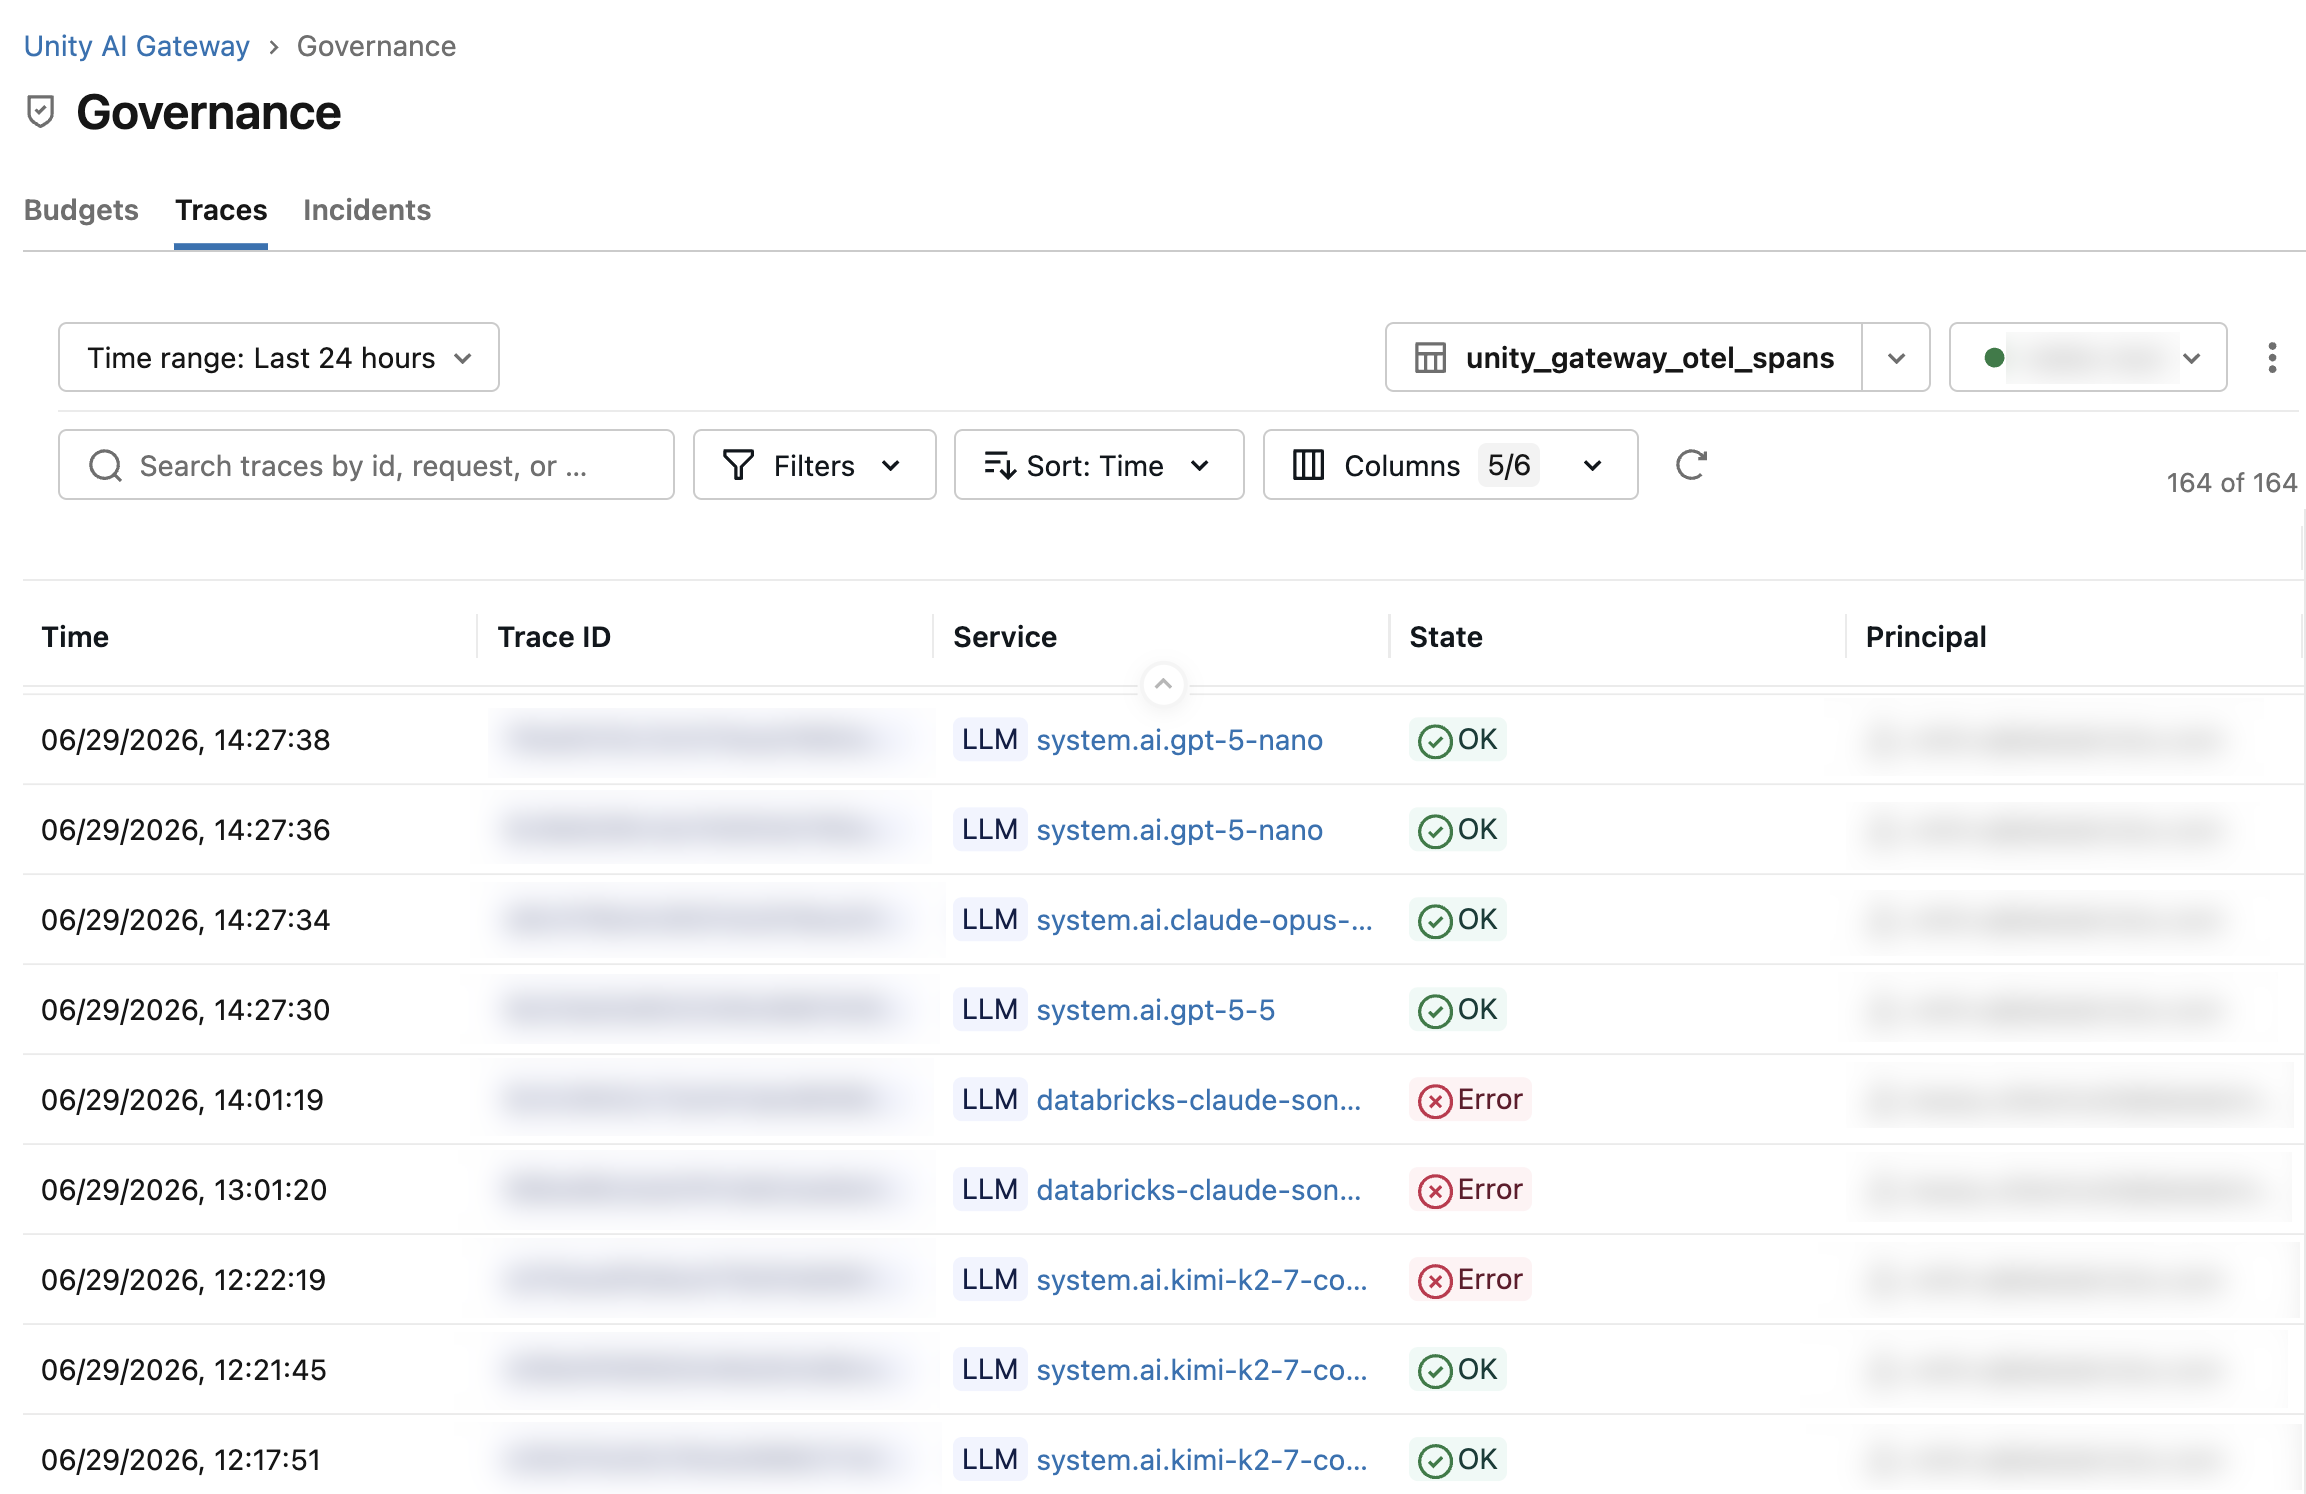
View traces in the UI
- In the workspace sidebar, click AI Gateway > Govern > Traces tab.
The Traces view provides the following controls:
- Search: Full-text search across the content in the current screen.
- Time range: Filter traces by time window (default: last 24 hours).
- Filters: Filter by Service (endpoint name), Principal (requester), Service type, State, or Execution time.
- Columns: Show or hide columns.
- Warehouse: Select the SQL warehouse used to run queries against the trace table.
Write queries with Genie Code
Genie Code is available throughout the workspace. Open Genie Code from the sidebar and ask it to write SQL queries against your trace table. Genie Code understands Unity Catalog table schemas automatically.
Example prompts:
- "Show me all rate limit errors on the customer-support-bot endpoint in the last 24 hours"
- "Which users had the longest p99 response times last week?"
- "Find all traces where the agent made more than three downstream calls"
Genie Code generates the SQL, which you can run directly in a notebook or the SQL editor.
Query with SQL or a notebook
The table is clustered by time. Include this column in your WHERE clause for best performance.
Replace <catalog>.<schema>.<table_name> with your trace table path.
-- All spans for a specific trace
SELECT * FROM <catalog>.<schema>.<table_name>
WHERE trace_id = 'afdd29f3a069482f8b102380ba0fb3c8'
ORDER BY start_time_unix_nano;

-- All errors on a specific endpoint in the last 24 hours
SELECT trace_id, name, status, attributes
FROM <catalog>.<schema>.<table_name>
WHERE service_name = '<catalog>.<schema>.<model>'
  AND status.code = 'STATUS_CODE_ERROR'
  AND time >= current_timestamp() - INTERVAL 1 DAY;

-- Root spans only (one row per request), with requester and HTTP status
SELECT trace_id, name,
  attributes:`enduser.id`::string AS requester
  attributes:`http.response.status_code`::int AS status_code,
  status.code
FROM <catalog>.<schema>.<table_name>
WHERE parent_span_id IS NULL
  AND service_name = '<catalog>.<schema>.<model>';
Permissions and access control
Because all Unity Gateway traffic lands in one table, you manage access in one place instead of maintaining separate permissions per endpoint.
By default, only metastore admins can query the trace table. The metastore admin who created the table is its owner. To give other users query access, the table owner must grant SELECT on the table, USE SCHEMA on the schema, and USE CATALOG on the catalog. Without a row filter, any user with these privileges can see traces for all services in the workspace, so Databricks recommends applying an ABAC row filter policy before granting access.
Scope access with ABAC policies
Databricks recommends attribute-based access control (ABAC) to give each user or team access to only the rows they should see. An ABAC row filter policy attaches a SQL function to the trace table (or its parent catalog or schema) that runs at query time. When a user runs SELECT *, they automatically get back only their rows, with no manual WHERE clause and no risk of reading another team's traces.
The following example implements a common policy: admins see all traces; endpoint owners see only their own service; everyone else sees nothing.
This example follows a convention where each service has a matching account group named <service_name>-owners. These groups are not created automatically. As part of setting up access, an admin must create each group and add the appropriate members, and must repeat this whenever a new endpoint is added. The filter function and policy do not change as groups are added.
-
Create the filter function. It receives a service name for each row and returns
TRUEif the current user is allowed to see it.SQLCREATE OR REPLACE FUNCTION <catalog>.<schema>.ai_traces_filter(svc STRING)
RETURNS BOOLEAN
RETURN is_account_group_member('admins')
OR is_account_group_member(svc || '-owners'); -
Tag the
service_namecolumn so the policy can bind to it. ABAC policies pass columns to the filter function by governed tag.SQLALTER TABLE <catalog>.<schema>.<table_name>
ALTER COLUMN service_name SET TAGS ('ai_trace_service' = ''); -
Create the row filter policy on the trace table.
SQLCREATE POLICY ai_traces_filter
ON TABLE <catalog>.<schema>.<table_name>
COMMENT 'Restrict trace visibility to service owners and admins'
ROW FILTER <catalog>.<schema>.ai_traces_filter
TO `account users`
FOR TABLES
MATCH COLUMNS has_tag('ai_trace_service') AS svc
USING COLUMNS (svc); -
Create the
<service_name>-ownersaccount group for each service (if it does not already exist), add its members, and grant it the privileges required to query the table:USE CATALOGon the catalog,USE SCHEMAon the schema, andSELECTon the table.SQLGRANT USE CATALOG ON CATALOG <catalog> TO `customer-support-bot-owners`;
GRANT USE SCHEMA ON SCHEMA <catalog>.<schema> TO `customer-support-bot-owners`;
GRANT SELECT ON TABLE <catalog>.<schema>.<table_name> TO `customer-support-bot-owners`;
With this policy in place, results are automatically filtered based on who runs the query:
- A member of
customer-support-bot-ownerswho runsSELECT * FROM <table>sees only rows whereservice_name = 'customer-support-bot'. - A member of the
adminsgroup sees all rows. - Any other user sees no rows.
When a new endpoint is added, repeat the last step: create the matching <service_name>-owners group and grant it SELECT. The policy and filter function do not change.
See Attribute-based access control in Unity Catalog for the full ABAC reference and Common patterns for row filtering and column masking for more row filter patterns.
Scope access with PII redaction
Another approach to opening up access is to materialize a version of the table with PII redacted. The redacted table can carry a wider SELECT grant that covers more users. The tradeoff is that traces are materialized twice: once in their unredacted form in the original table, which keeps strict access requirements, and once in their redacted form in a separate table that is open to more consumers.
For a reference solution that redacts PII from OpenTelemetry traces in Unity Catalog, see Govern and redact traces in Unity Catalog.
Schema
Each row in the unified trace table is one OpenTelemetry span. For the full column list, attribute keys, and policy evaluation event fields, see Unified trace table schema reference.
Limitations
- The maximum attribute size that is logged is 3 MiB (3,145,728 bytes). Attributes that exceed this are truncated. The span is marked with
databricks.trace.payload_truncatedand itsdropped_attributes_countis incremented. - Trace log delivery is best-effort. Most traces will arrive within seconds, however for new tables, traces may take up to an hour to arrive.
- Trace logs are not guaranteed for 401, 403, 429, or 500 errors.
- The trace table may stop receiving logs or become corrupted if you change the table schema, rename the table, or delete the table.
- Databricks does not manage the lifecycle of the trace table; without a retention policy, it grows indefinitely. To delete rows automatically after a set period, enable auto time-to-live (Auto-TTL) on the table, which runs
DELETEandVACUUMin the background. To manage retention yourself, schedule a periodicDELETEto remove expired rows, followed byVACUUMto reclaim their storage. RunningVACUUMalone only removes files that are already unreferenced; it does not delete any rows. Define a retention policy before enabling tracing in production. - By default, only metastore admins can query the trace table. A metastore admin must configure ABAC row filter policies and grant
SELECT,USE SCHEMA, andUSE CATALOGbefore endpoint creators or security teams can access their own traces.