Filter on fields
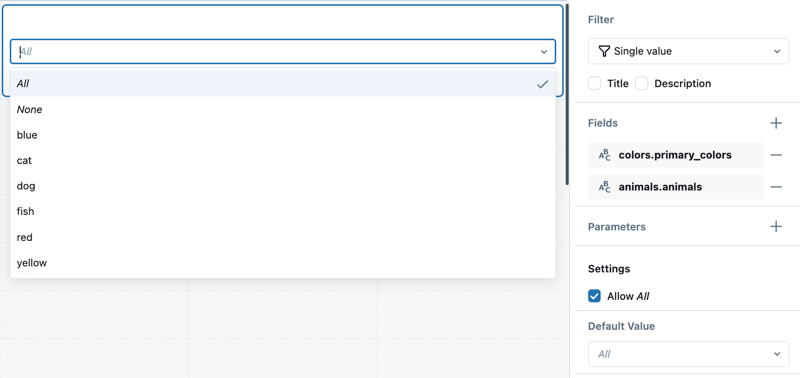
Field filters narrow data by specific dataset fields. For example, a field filter might limit data to a particular date range based on a date field in a dataset. Field filters can be connected to one or more datasets, allowing dynamic changes to available filter values based on selections. To connect a filter to fields from more than one dataset, add multiple Fields, up to one per dataset. The filter applies to all visualizations built on the selected datasets. Selecting a value for one filter dynamically changes the available values shown in the drop-down menus for other filters. The following image shows a filter configuration panel set to filter on two fields.
Static widget filters
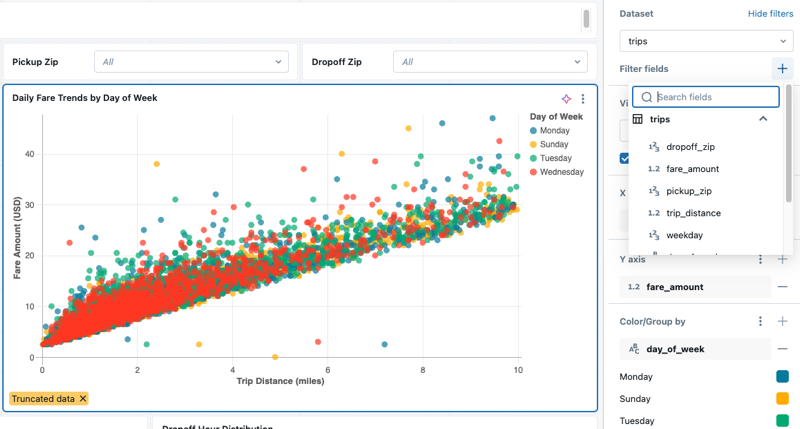
Static widget-level filters display a view of the dataset set by the dashboard author. These apply only to the widget where they are configured, enabling unique views of the same dataset in different widgets. Unlike global and page-level filters, static widget filters apply only to the visualization widget where they are configured. Their filter values can't be changed by dashboard viewers.
Example use case
Suppose you are creating a sales dashboard that analyzes regional performance. You use a dataset with sales data for all regions. By applying static widget filters, you can configure one widget to display sales for Region A and another widget to display sales for Region B. This approach allows viewers to compare regional performance side by side, even though both widgets draw from the same dataset. Because static widget filters are fixed, viewers can't modify the filters, ensuring the dashboard always presents a consistent view of the data.
Supported filter types for widget-level filters
Widget-level filters support the following filter types:
- Single value: Filter on a specific value from a field
- Multiple values: Filter on one or more values from a field
- Date picker: Filter on a specific date
- Date range picker: Filter on a date range, including relative date ranges (such as last 7 days, last month)
- Range slider: Filter on a numeric range
- Text entry: Filter based on text matching
For configuration examples of each filter type, see Dashboard filter types.
Add a static widget-level filter
To add a static widget-level filter to a visualization:
-
Add a visualization widget to the draft dashboard canvas.
-
With the new widget selected, choose a dataset from the Dataset drop-down in the configuration panel.
-
Click Show filters. A Filter fields option appears under the dataset title. For datasets that include parameters, a Parameters section also appears.
To add a field filter, do the following:
- Click the
 plus icon to the right of the Filter fields heading and choose a field from the drop-down menu.
 - By default, the filter value is set to All. Use the drop-down menu to choose a new value. Navigate away from the drop-down menu to show the visualization with the new filter applied.
- Review your dashboard.
To learn about setting a static widget-level parameter, see Static widget parameters.