Text widgets
Text widgets let you add formatted text, links, and images to your dashboards. Drag a text widget onto the canvas and double-click it to start editing.
![]()
Use the formatting toolbar to style content in the following ways:
- Text styling: Adjust block style, font style, font size, and font color.
- Insert links: Click the link icon to open the link editor. Enter the URL and the link text to display in the widget.
- Insert images: Click the image icon to open the image editor. Enter a URL or path to your image and, optionally, alt text. See Image paths and URLs for supported paths and URLs.
You can also use markdown syntax to edit text. Click the ![]() kebab menu > Show markdown to view the text widget in markdown syntax. For details about basic markdown syntax, see the Markdown guide.
kebab menu > Show markdown to view the text widget in markdown syntax. For details about basic markdown syntax, see the Markdown guide.
The following example demonstrates the formatting capabilities available in text widgets. You can copy this markdown and paste it into a text widget in your own dashboard to see the formatted output.
Markdown example
## Q1 2026 Sales Performance

### Overview

This quarter showed **strong growth** across all regions, with _total revenue_ exceeding targets by 15%. The `EMEA` region led with 22% growth year-over-year.

### Regional Performance

| Region        | Revenue | Growth | Status      |
| :------------ | :------ | :----- | :---------- |
| North America | $2.4M   | +12%   | ✅ On Track |
| EMEA          | $1.8M   | +22%   | ✅ On Track |
| APAC          | $1.2M   | +8%    | ⚠️ Monitor  |

### Key Highlights

- **Product launches**: Successfully launched 3 new features in March
- **Customer acquisition**: Added 450 new enterprise customers
- **Retention rate**: Maintained 95% customer retention
- **Market expansion**: Entered 2 new geographic markets

### Next Steps

Review the detailed breakdown in the [Sales Analysis Dashboard](#) and explore customer feedback in the [Customer Insights Report](#).

---

_Last updated: March 31, 2026_
This example demonstrates various formatting options including headings, styled text, tables, lists, and links. Customize the markdown to match your dashboard content. The formatted output appears in your dashboard as shown:
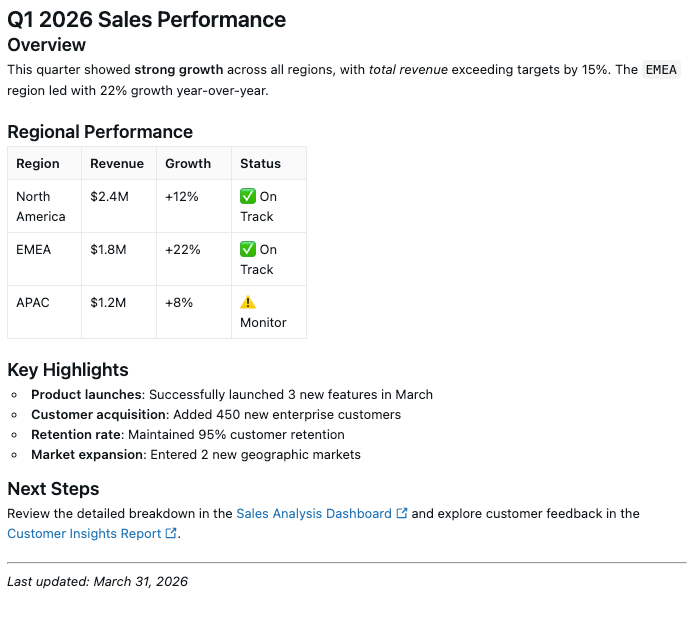
Image paths and URLs
Use one of the following methods to specify a URL or volume path for an image.
Use a Volume path
Use the following format, replacing the placeholders with your Databricks instance name and the path to the image in your Volume:
https://<databricks-instance>/ajax-api/2.0/fs/files/<Volumes/path/to/image>
Your instance name is in the first part of the URL that appears when you log in to your Databricks deployment. Some deployments include a workspace ID. Do not include the workspace ID when constructing the path. To learn more, see Workspace instance names, URLs, and IDs.
To find the Volume path:
- Click
 Catalog in the sidebar to open Catalog Explorer.
 - Click the image file in the schema browser.
- Click the
 kebab menu next to the file name, then click Copy Path.
See What are Unity Catalog volumes? to learn more about storing data in Volumes.
Regardless of whether your dashboard is published with shared or individual data permissions, you must explicitly grant users access to image files stored on Databricks. Use Catalog Explorer to check, grant, and revoke permissions on the image files that you want to include. Click ![]() Catalog in the sidebar to open the Catalog Explorer UI.
Catalog in the sidebar to open the Catalog Explorer UI.
Use a publicly hosted image
For publicly hosted images, insert the public URL that points to the image.