Create a profile using the Databricks UI
This article demonstrates create a data profile using the Databricks UI. You can also use the API.
To access the Databricks UI, do the following:
-
In the workspace left sidebar, click
 to open Catalog Explorer.
 -
Navigate to the table you want to profile.
-
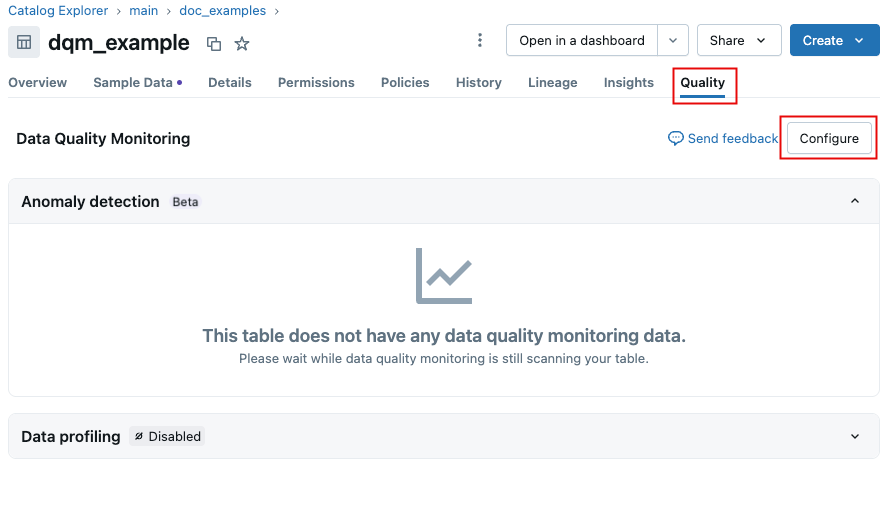
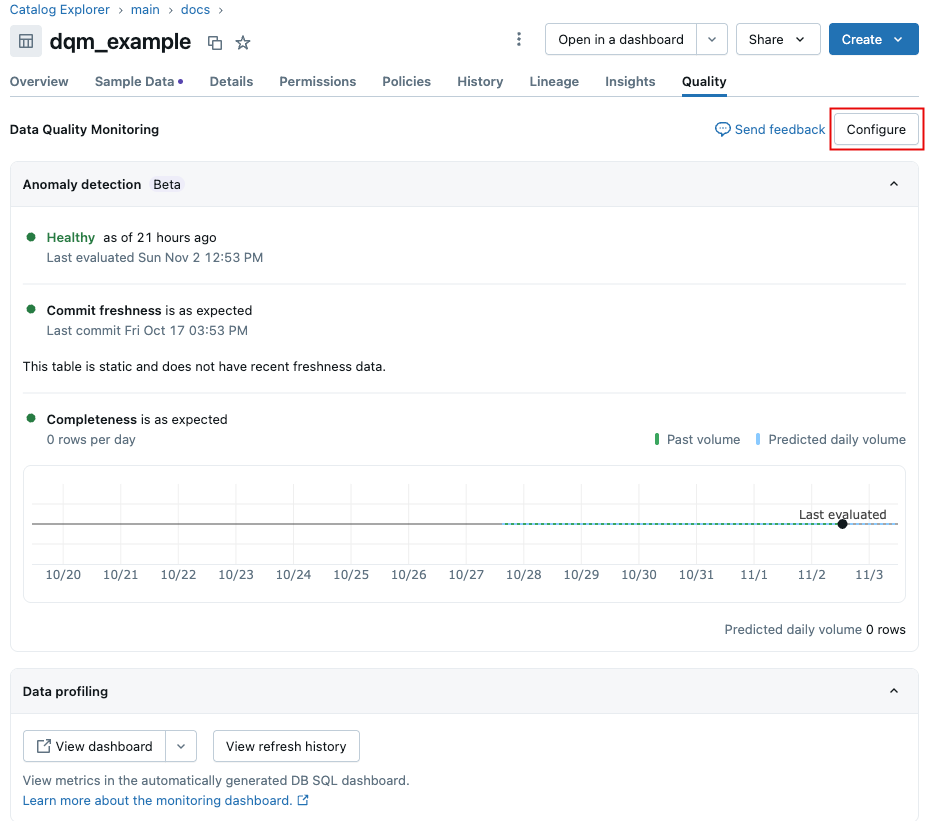
Click the Quality tab.
-
If anomaly detection is not enabled for this schema, click Enable.
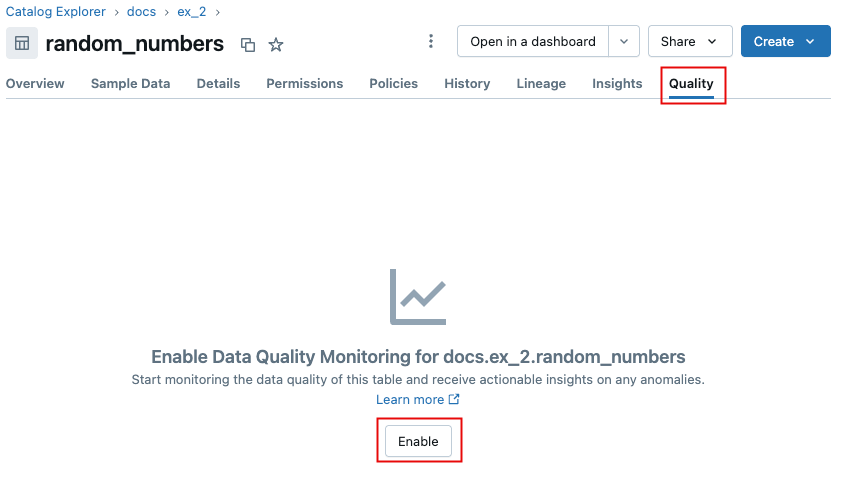
If anomaly detection is enabled for this schema, click Configure.
-
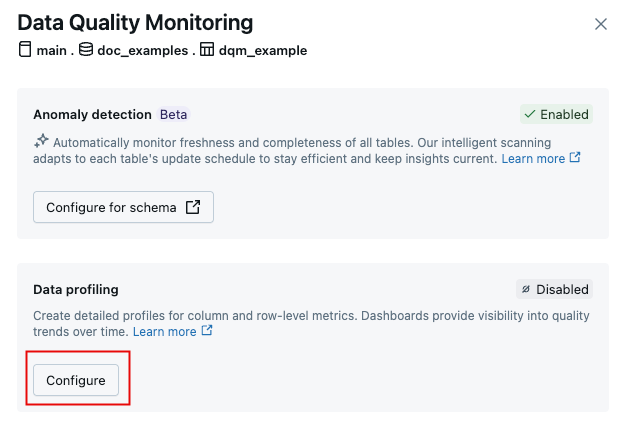
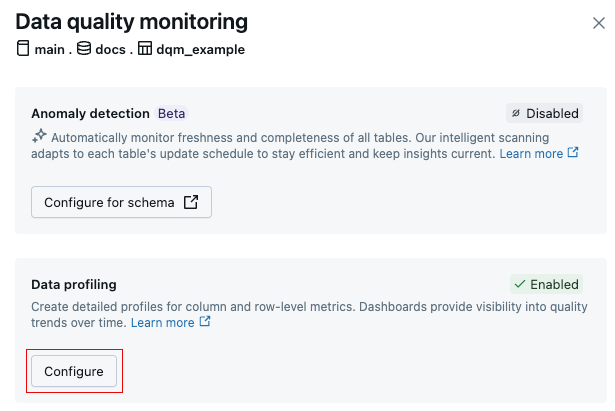
In the Data Quality Monitoring dialog, in the Data profiling field, click Configure.
-
In the dialog, select the Profile type. The following sections describe the profile type options and the additional selections for each type.
Profiling
From the Profile type drop-down menu, select the type of profile you want to create. The profile types are shown in the table.
Profile type | Description |
|---|---|
Time series profile | A table containing values measured over time. This table includes a timestamp column. |
Snapshot profile | Any Delta managed table, external table, view, materialized view, or streaming table. The maximum table size for a snapshot profile is 4TB. For larger tables, use time series profiles instead. |
Inference profile | A table containing predicted values output by a machine learning classification or regression model. This table includes a timestamp, a model id, model inputs (features), a column containing model predictions, and optional columns containing unique observation IDs and ground truth labels. It can also contain metadata, such as demographic information, that is not used as input to the model but might be useful for fairness and bias investigations or other tasks. |
If you select TimeSeries or Inference, additional parameters are required and are described in the following sections.
- When you first create a time series or inference profile, the profile analyzes only data from the 30 days prior to its creation. After the profile is created, all new data is processed.
- Monitors defined on materialized views do not support incremental processing.
For TimeSeries and Inference profiles, it's a best practice to enable change data feed (CDF) on your table. When CDF is enabled, only newly appended data is processed, rather than re-processing the entire table every refresh. This makes execution more efficient and reduces costs as you scale profiling across many tables.
TimeSeries profile
For a TimeSeries profile, you must make the following selections:
- Specify the Metric granularities that determine how to partition the data in windows across time.
- Specify the Timestamp column, the column in the table that contains the timestamp. The timestamp column data type must be either
TIMESTAMPor a type that can be converted to timestamps using theto_timestampPySpark function.
Inference profile
For a Inference profile, in addition to the granularities and the timestamp, you must make the following selections:
- Select the Problem type, either classification or regression.
- Specify the Prediction column, the column containing the model's predicted values.
- Optionally specify the Label column, the column containing the ground truth for model predictions.
- Specify the Model ID column, the column containing the id of the model used for prediction.
Advanced options
In the Advanced options section, you can set the schedule, add email notifications, add custom metrics and slicing expressions, and change the default profile configuration.
Schedule
To set up a profile to run on a scheduled basis, select Refresh on schedule and select the frequency and time for the profile to run. If you do not want the profile to run automatically, select Refresh manually. If you select Refresh manually, you can later refresh the metrics from the Quality tab.
Notifications
To set up email notifications for a profile, enter the email to be notified and select the notifications to enable. Up to 5 emails are supported per notification event type.
Metrics
In the Metrics section, you can choose to change the following default settings:
-
Metrics tables schema name: The Unity Catalog schema where the metric tables created by the profile are stored. This location must be in the format {catalog}.{schema}. By default, this is set to the same schema location as the profiled table. You can specify a different location.
-
Assets directory: The absolute path to an existing directory to store data profiling assets. By default, assets are stored in the default directory: "/Users/{user_name}/databricks_lakehouse_monitoring/{table_name}". If you enter a different location in this field, assets are created under "/{table_name}" in the directory you specify. This directory can be anywhere in the workspace. For profiles intended to be shared within an organization, you can use a path in the "/Shared/" directory.
This field cannot be left blank.
You can also specify the following settings:
- Unity Catalog baseline table name: Name of a table or view that contains baseline data for comparison.
- Metric slicing expressions: Slicing expressions let you define subsets of the table to profile in addition to the table as a whole. To create a slicing expression, click Add expression and enter the expression definition. For example the expression
"col_2 > 10"generates two slices: one forcol_2 > 10and one forcol_2 <= 10. As another example, the expression"col_1"will generate one slice for each unique value incol_1. The data is grouped by each expression independently, resulting in a separate slice for each predicate and its complements. - Custom metrics: Custom metrics appear in the metric tables like any built-in metric.
To configure a custom metric, click Add custom metric.
- Enter a Name for the custom metric.
- Select the custom metric Type. Choose from:
Aggregate,Derived, orDrift. - From the drop-down list in Input columns, select the columns to apply the metric to.
- In the Output type field, select the Spark data type of the metric.
- In the Definition field, enter SQL code that defines the custom metric.
Edit profile settings in the UI
After you have created a profile, you can make changes to the profile's settings by clicking Configure on the Quality tab.
In the Data profiling section of the dialog, click Configure.
Refresh and view profile results in the UI
To run the profile manually, click View refresh history. A dialog opens showing all previous profiles. Click Refresh metrics to trigger a profile update.
To see the refresh history, you must use the Databricks workspace from which data profiling was enabled.
For information about the statistics that are stored in profile metric tables, see Monitor metric tables. Metric tables are Unity Catalog tables. You can query them in notebooks or in the SQL query explorer, and view them in Catalog Explorer.
Control access to profile outputs
The metric tables and dashboard created by a profile are owned by the user who created the profile. You can use Unity Catalog privileges to control access to metric tables. To share dashboards within a workspace, click the Share button on the upper-right side of the dashboard.
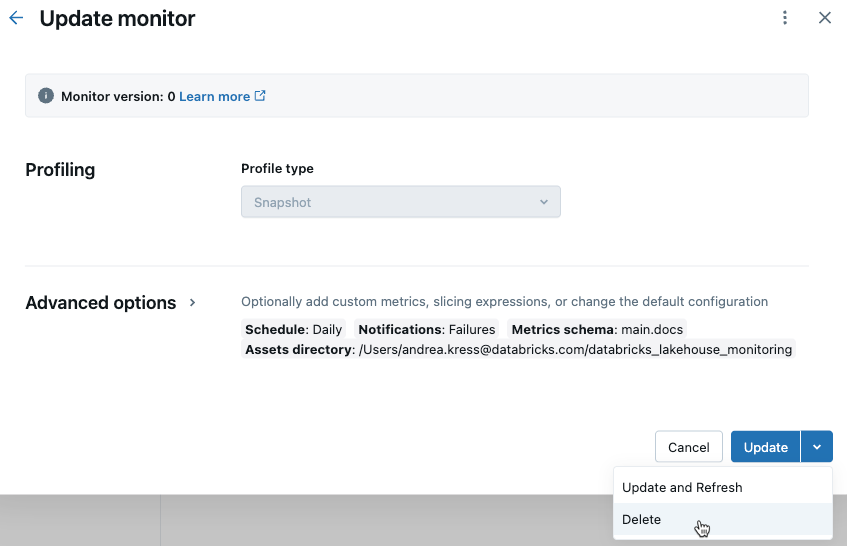
Delete a profile from the UI
To delete a profile from the UI, follow the instructions in Edit profile settings in the UI to open the Update profile dialog. From the Update dropdown menu, select Delete.