Monitor pipelines in the UI
This section describes using built-in monitoring and observability features for Lakeflow Spark Declarative Pipelines in the Databricks user interface. These features support tasks such as:
- Observing the progress and status of pipeline updates. See Pipeline details available in the monitoring page.
- Alerting on pipeline events such as the success or failure of pipeline updates. See Add email notifications for pipeline events.
- Viewing metrics for streaming sources like Apache Kafka and Auto Loader (Public Preview). See View streaming metrics.
Add email notifications for pipeline events
You can configure one or more email addresses to receive notifications when the following occurs:
- A pipeline update completes successfully.
- A pipeline update fails, either with a retryable or a non-retryable error. Select this option to receive a notification for all pipeline failures.
- A pipeline update fails with a non-retryable (fatal) error. Select this option to receive a notification only when a non-retryable error occurs.
- A single data flow fails.
To configure email notifications, edit the settings for a pipeline. See Notifications.
Create custom responses to events, including notifications or custom handling, by using Python event hooks.
Viewing pipelines in the UI
Find your pipeline from the ![]() Jobs & Pipelines option in the workspace sidebar. This opens the Jobs & pipelines page, where you can view information about each job and pipeline you have access to. Click the name of a pipeline to open the pipeline monitoring page. To edit the job or pipeline, click the
Jobs & Pipelines option in the workspace sidebar. This opens the Jobs & pipelines page, where you can view information about each job and pipeline you have access to. Click the name of a pipeline to open the pipeline monitoring page. To edit the job or pipeline, click the ![]() menu and choose Edit.
menu and choose Edit.
Jobs and different pipeline types have different editors. The Edit option will open the correct editor for the object you select.
Using the Jobs & pipelines list
To view the list of pipelines you have access to, click ![]() Jobs & Pipelines in the sidebar. The Jobs & pipelines tab lists information about all available jobs and pipelines, such as the creator, the trigger (if any), and the result of the last five runs.
Jobs & Pipelines in the sidebar. The Jobs & pipelines tab lists information about all available jobs and pipelines, such as the creator, the trigger (if any), and the result of the last five runs.
Clicking the name of a pipeline or job takes you to the monitoring page for that pipeline or job. To edit the pipeline or job, click the ![]() , then select Edit.
, then select Edit.
To change the columns displayed in the list, click ![]() and select or deselect columns. For example, to add the
and select or deselect columns. For example, to add the Pipeline Type as a column, select that column to view.
You can filter jobs in the Jobs & pipelines list as shown in the following screenshot.
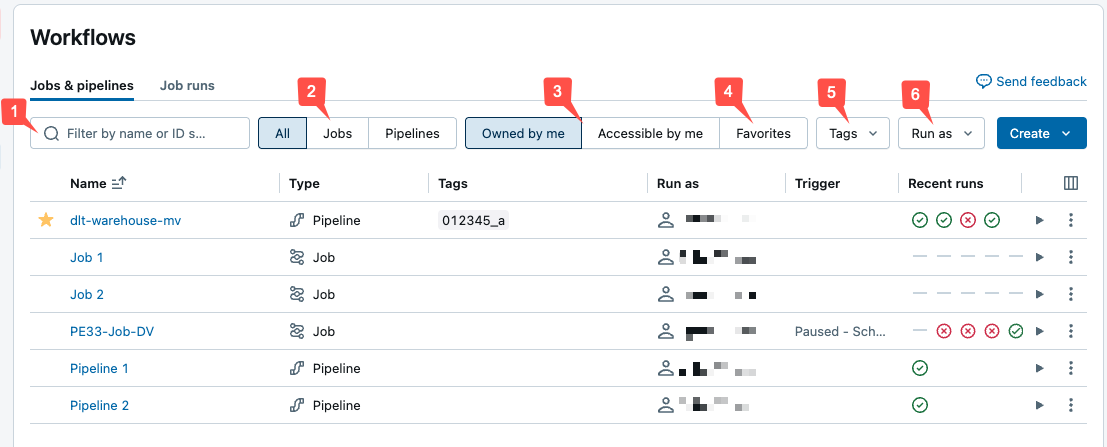
- Text search: keyword search is supported for the Name and ID fields. To search for a tag created with a key and value, you can search by the key, the value, or both the key and value. For example, for a tag with the key
departmentand the valuefinance, you can search fordepartmentorfinanceto find matching jobs. To search by the key and value, enter the key and value separated by a colon (for example,department:finance). - Type: filter by Jobs, Pipelines, or All. If you select Pipelines you can also filter by Pipeline type, which includes ETL and Ingestion pipelines.
- Owner: show only the jobs you own.
- Favorites: show jobs you have marked as favorites.
- Tags: Use tags. To search by tag you can use the tags drop-down menu to filter for up to five tags at the same time or directly use the keyword search.
- Run as: Filter by up to two
run asvalues.
To start a job or a pipeline, click the ![]() play button. To stop a job or a pipeline, click the
play button. To stop a job or a pipeline, click the ![]() stop button. To access other actions, click the kebab menu
stop button. To access other actions, click the kebab menu ![]() . For example, you can edit or delete the job or pipeline, or access settings for a pipeline from that menu.
. For example, you can edit or delete the job or pipeline, or access settings for a pipeline from that menu.
Pipeline details available in the monitoring page
There are multiple previews that can affect what you see when monitoring pipelines in the UI.
- The Lakeflow Pipelines Editor changes the experience for pipeline details. If you are opted into the preview, the information is displayed in an different UI than described here. For details on that UI, see What changes are in the Lakeflow Pipelines Editor?.
- The Unified Runs List preview adds pipeline runs to the jobs run list. For details on the changes with that preview enabled, and how to enable it, see What changes are in the Unified Runs List preview?.
Clicking the name of a pipeline in the Jobs & Pipelines page shows the monitoring page for that pipeline. From here you can start a pipeline run, and view previous run details.
The pipeline graph (also called DAG) appears as soon as an update to a pipeline has successfully started. Arrows represent dependencies between datasets in your pipeline. By default, the pipeline monitoring page shows the most recent update for the table, but you can select older updates from a drop-down menu.
Details include the pipeline ID, source code, compute cost, product edition, and the channel configured for the pipeline.
To see a tabular view of datasets, click the List tab. The List view allows you to see all datasets in your pipeline represented as a row in a table and is useful when your pipeline graph is too large to visualize in the Graph view. You can control the datasets displayed in the table using multiple filters such as dataset name, type, and status. To switch back to the DAG visualization, click Graph.
The Run as user is the pipeline owner, and pipeline updates run with this user's permissions. To change the run as user, click Permissions and change the pipeline owner.
What changes are in the Lakeflow Pipelines Editor?
If you are opted into the Lakeflow Pipelines Editor preview, and the new pipeline monitoring UI, some information is in different places in the UI. For information about the Lakeflow Pipelines Editor, and opting into both previews see Enable the Lakeflow Pipelines Editor and updated monitoring.
This feature is in Public Preview.
The following changes to monitoring with the pipeline monitoring page appear when opted into both previews:
-
The Pipeline details and Update details tabs in the right panel have been merged with pipeline details at the top, followed by update details.
-
Clicking on a table in the graph does not show the table details in the right panel. The right panel continues to show the pipeline and update details. Instead, the bottom panel shows table information.
-
Rules for running a pipeline in development mode are slightly updated. For information about development mode, see Development mode.
- Running a pipeline via a schedule or trigger follows the pipeline setting for whether to use development mode. You can change the default for a pipeline in Pipeline settings.
- Running a pipeline through the monitoring UI will use the mode defined in the pipeline settings. You can choose whether to use development mode by using the Run with different settings option in the drop-down.
- Running a pipeline from the pipeline editor will default to the development mode. You can choose to not use development mode by using the Run with different settings option in the drop-down.
-
There is no longer a link to the source code in the pipeline details. Instead, choose Edit pipeline across the top. To jump to the code for a specific table, hover over the table in the DAG, and click the
 Navigate to code button.
 -
The event log is no longer shown by default on every update from the pipeline monitoring page. When there is an error during processing, the errors are shown in the bottom panel, and a View logs button is shown to view the event log for that run. The event log is also available by selecting
 View event log from the run details in the right panel.
To access the event log when running an update in the new Lakeflow Pipelines Editor, navigate to the Issues and Insights panel at the bottom of the editor, click View logs, or the Open in logs button next to any error. For more details, see Lakeflow Pipelines Editor, and Pipeline setting for event log.
-
Table schema information is available by choosing the table in Tables tab of the bottom panel, and then selecting Columns.
-
Query history is available by choosing Performance in the bottom panel.
-
Table comments are not available from the pipeline details page. To see table comments, view the table from Catalog Explorer. To jump directly to the table in Catalog Explorer, hover the mouse over the table in the DAG, then click the
 , and then
  View in catalog. You can also access the information in Catalog explorer from the list of tables in the bottom panel by clicking on the icon.
What changes are in the Unified Runs List preview?
If you have the Unified Runs List preview enabled, you can see pipeline run updates in the Jobs & Pipelines page.
Unified runs list is in Public Preview.
To enable Unified Runs List, a workspace admin must opt into the preview. For details on opting into a preview, see Manage account-level previews.
To access the unified runs list, either select ![]() Runs from the workspace sidebar, or Click
Runs from the workspace sidebar, or Click ![]() Jobs & Pipelines, then choose the Runs tab.
Jobs & Pipelines, then choose the Runs tab.
The tab shows a list of recent runs over the last 60 days. A graph showing success and failure of runs over the last 48 hours is displayed first, in the following cases:
- You are filtered to just Jobs or Pipelines.
- You are an admin, or filter to only runs
Run as: Me - Runs can take up to an hour to show on the graph.
You can filter the list and the graph by:
- Name of the job or pipeline.
- All, Jobs, or Pipelines.
- Pipeline type (ETL, Ingestion, MV/ST, or Database Table Sync).
- The Run as user.
- The run Start time (within the last 48 hours).
- The Run status.
- The Error code for failed runs.
Besides the above, you can view the following columns in the list:
- End time
- Run ID
- Whether the run was Launched manually or by a schedule.
- Run Duration.
- Run parameters.
To change the columns displayed in the runs list, click ![]() and select or deselect columns.
and select or deselect columns.
Clicking the Start time, End time, or Name of a pipeline run takes you to the monitoring page for the pipeline.
When a pipeline is actively running, you can stop the run by clicking the ![]() stop button. At any time, you can also click
stop button. At any time, you can also click ![]() menu button on the row for the run, and choose Edit pipeline to view the pipeline in the editor.
menu button on the row for the run, and choose Edit pipeline to view the pipeline in the editor.
How can you view dataset details?
Clicking on a dataset in the pipeline graph or dataset list shows details about the dataset. Details include the dataset schema, data quality metrics, and a link to the source code defining the dataset.
View update history
To view the history and status of pipeline updates, click the update history drop-down menu in the top bar.
Select the update in the drop-down menu to view the graph, details, and events for an update. To return to the latest update, click Show the latest update.
View streaming metrics
Streaming observability for pipelines is in Public Preview.
You can view streaming metrics from the data sources supported by Spark Structured Streaming, like Apache Kafka, Amazon Kinesis, Auto Loader, and Delta tables, for each streaming flow in your pipeline. Metrics are displayed as charts in the pipeline UI's right pane and include backlog seconds, backlog bytes, backlog records, and backlog files. The charts display the maximum value aggregated by minute and a tooltip shows maximum values when you hover over the chart. The data is limited to the last 48 hours from the current time.
Tables in your pipeline with streaming metrics available display the ![]() icon when viewing the pipeline DAG in the UI Graph view. To view the streaming metrics, click the
icon when viewing the pipeline DAG in the UI Graph view. To view the streaming metrics, click the ![]() to display the streaming metric chart in the Flows tab in the right pane. You can also apply a filter to view only tables with streaming metrics by clicking List and then clicking Has streaming metrics.
to display the streaming metric chart in the Flows tab in the right pane. You can also apply a filter to view only tables with streaming metrics by clicking List and then clicking Has streaming metrics.
Each streaming source supports only specific metrics. Metrics not supported by a streaming source are not available to view in the UI. The following table shows the metrics available for supported streaming sources:
source | backlog bytes | backlog records | backlog seconds | backlog files |
|---|---|---|---|---|
Kafka | ✓ | ✓ | ||
Kinesis | ✓ | ✓ | ||
Delta | ✓ | ✓ | ||
Auto Loader | ✓ | ✓ | ||
Google Pub/Sub | ✓ | ✓ |