Diagnose Lakeflow Jobs performance
When a job or task takes longer than expected, use the Jobs UI to understand where time is spent and what you can do to reduce it. The Jobs UI shows the run breakdown, streaming task metrics, and query performance metrics for serverless jobs. To find and open job runs, see Monitor Lakeflow Jobs.
View the run breakdown by phase
The run breakdown shows where a job or task run spends time. When you view job run details, hover over the run's Duration to see the total duration broken down into the following phases:
- Queued
- Waiting for resources
- Library installation
- Running
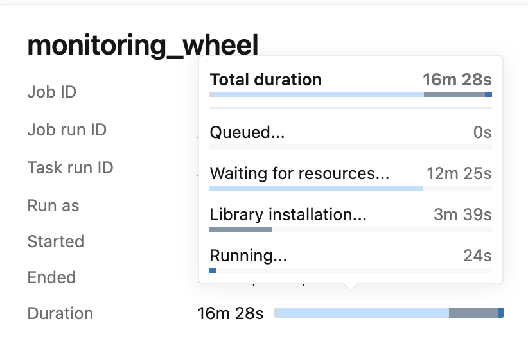
The run breakdown is available for both job runs and task runs. For a job with multiple tasks, the job-level breakdown counts Waiting for resources only until the first task starts running. For the full breakdown of each task, view the run breakdown in the task run output.
Use the breakdown to identify which phase takes the most time, then use the following sections to understand the possible causes and what you can do to reduce that time.
Pipeline tasks have different phases than most tasks. They are: created, waiting for resources, initializing, setting up tables, and running. For guidance on reducing high initialization and table setup times, see Fix high initialization times in pipelines.
Queued phase
Your job or task is waiting to start because of concurrency limits.
Possible causes:
- The job reached its maximum concurrent runs limit because a previous run of the same job is still in progress.
- Other jobs running at the same time reached the workspace-level concurrent run limit.
What you can do:
- Increase the maximum concurrent runs setting for the job.
- Review your job schedules to reduce overlap. If jobs consistently compete for resources, consider staggering their start times. For more information, see the Databricks resource limits.
Waiting for resources phase
Your job or task is waiting for compute to become available before it can start running. What you can do to reduce the amount of wait time depends on your compute type.
Compute type | Possible causes | What you can do |
|---|---|---|
Serverless | The serverless job uses standard performance mode, which has a startup latency of 4 to 6 minutes, depending on compute availability and whether you use Spark. | Switch to performance-optimized mode to reduce startup time. |
Classic |
|
|
Library installation phase
Your job is spending time installing libraries before it begins running.
Compute type | Possible causes | What you can do |
|---|---|---|
Serverless |
|
|
Classic | Library installation time is high because of the size and complexity of the environment defined on the cluster, especially when you use init scripts to install libraries at cluster startup. | Verify that the job uses only the packages needed for the run. |
Running phase
A run can take longer than expected for many reasons. The following list is not exhaustive, but it covers some common causes and possible actions.
Possible causes:
- Data volume increased, so a longer runtime might be expected.
- Job or compute configuration changed.
- Code changes introduced slower queries or inefficient operations.
What you can do:
- Review recent changes using Databricks system tables, such as the jobs system tables and compute system tables.
- For serverless jobs, use query history to find which queries took the longest, and open their query profile to identify optimization opportunities. To find the relevant queries, open the job's Timeline view by clicking Timeline or Switch to timeline, which integrates with query profiles, or use the Query history link in the Compute section of each task.
- For jobs running on classic compute, use the Spark UI to diagnose slow stages and tasks. Start with the event timeline to spot long-running jobs, idle gaps, or failures, then drill into individual stages and tasks for details.
For serverless jobs, you can get additional streaming task metrics (Public Preview) and query performance metrics.
View metrics for streaming tasks
Streaming observability for Lakeflow Jobs is in Public Preview.
The Lakeflow Jobs UI provides streaming observability metrics for streaming workloads on the Job run details page. These metrics include backlog seconds, backlog bytes, backlog records, and backlog files for sources supported by Spark Structured Streaming, including Apache Kafka, Amazon Kinesis, Auto Loader, Google Pub/Sub, and Delta tables. When you view the run details for a task, the metrics appear as charts in the right-hand pane. Each chart shows maximum values aggregated by minute, for up to the previous 48 hours.
Each streaming source supports only specific metrics. The UI displays only the metrics that a streaming source supports. The following table shows the metrics available for supported streaming sources:
source | backlog bytes | backlog records | backlog seconds | backlog files |
|---|---|---|---|---|
Kafka | ✓ | ✓ | ||
Kinesis | ✓ | ✓ | ||
Delta | ✓ | ✓ | ||
Auto Loader | ✓ | ✓ | ||
Google Pub/Sub | ✓ | ✓ |
You can also specify thresholds for each streaming metric and configure notifications if a stream exceeds a threshold during a task run. See Configure notifications for slow jobs.
To view streaming metrics for a task run that streams data from one of the supported Structured Streaming sources:
- On the Job run details page, click the task for which you want to view metrics.
- Click the Metrics tab in the Task run pane.
- To open the graph for a metric, click
 next to the metric name.
 - To view the metrics for a specific stream, enter the stream ID in the Filter by stream_id text box. You can find the stream ID in the output for the job run.
- To change the time period for the metric graphs, use the time drop-down menu.
- To move through the streams if the run contains more than ten streams, click Next or Previous.
Streaming observability limitations
- Databricks updates metrics every minute unless a run has more than four streams. If a run has more than four streams, Databricks updates the metrics every five minutes.
- Databricks collects metrics only for the first fifty streams in each run.
- Databricks collects metrics at one-second intervals. The metrics might not be visible if your
triggerIntervalsetting is less than one second. - Most data sources collect streaming metrics by default. However, for others, you must enable this feature. If your data source isn't collecting streaming metrics, set the
spark.sql.streaming.metricsEnabledflag toTrue.
View query performance metrics for serverless jobs
When you run a serverless job, Databricks surfaces selected Query Profile metrics and performance insights directly in the job run UI, so you can identify performance issues without opening a separate query profile for each query. Use these metrics to investigate why a run is slow, or to compare performance between two runs.
Databricks displays the following query metrics and performance insights for a serverless job run:
- Rows read and rows written per task run and aggregated across tasks for the job run.
- Total number of queries per task run and aggregated across tasks for the job run.
- A performance insights indicator (lightbulb) on a task when one or more queries in that task have performance insights.
- Performance insights in the job run sidebar that aggregate insights across tasks, suggest next steps, and link to affected queries.
These metrics and insights appear in different places depending on how you're viewing the run:
Where it appears | What you see |
|---|---|
Job run sidebar | Rows read and written, total query count, and performance insights across task runs. |
Task run sidebar | Rows read and written, total query count, and an insights indicator for the task run. |
Graph view | A lightbulb badge on a task node when any of the task's queries have performance insights. |
Timeline view | A lightbulb next to the task name with a count of queries with insights, plus a lightbulb on each query that has insights. |
List view | A lightbulb in the Insights column when any of the task's queries have performance insights. If you don't see this column, add it from the column picker. |
Click and hover behavior:
- In the Timeline view, hover over a task to see its aggregated metrics and any performance insights for the task's queries.
- In the Graph view or List view, click the lightbulb on a task to open the Timeline view with that task's queries expanded.
- In the Timeline view, click the query text of a query that has a lightbulb to open a pane with an overview of the performance insights for that query.
To investigate why a serverless job runs slower than expected:
- Open the job run.
- Switch to the Timeline view.
- Identify tasks taking longer than expected based on the duration distribution.
- Hover over a long-running task to see:
- Rows read and rows written: check whether the task processed more data than usual.
- Total number of queries: spot changes in workload shape.
- The performance insights indicator: spot regressions or inefficient code changes.
- If higher data volume explains the increased duration, the slowdown might be expected. Otherwise, expand the task in the timeline to see its individual queries. Queries with detected insights show a lightbulb next to them.
- Click the query text of a query with a lightbulb to open a pane with the performance insights for that query.
- Apply the recommended changes and re-run the job to confirm the issue is resolved.
If Optimize appears in the task run's Query metrics section, select it to open Genie Code with the job's insights. Review any proposed changes before accepting them. See Optimize with Genie Code.
For the full list of insights and what they mean, see Query performance insights. For deeper query execution details, see Query profile.
These same metrics make it simple to spot differences between a slow run and a previous fast run. Open both runs side by side and compare:
- Rows read and rows written to identify changes in data volume.
- Total number of queries to identify changes in workload shape.
- Performance insights to identify inefficiencies introduced since the previous run.
Query performance metrics limitations
- These metrics and insights apply to serverless Lakeflow Jobs only. Job runs on classic compute don't show this information.
- Task run query metrics include the first 100 queries in each task run. If a task run has more queries, its metrics reflect only the first 100.
- Job run query metrics combine metrics from up to 50 task runs, using the first 100 queries in each task run.