Anomaly detection
This feature is in Public Preview.
This page describes what anomaly detection is, what it monitors, and how to use it.
Anomaly detection uses default storage to store scan results in the system.data_quality_monitoring.table_results system table. You are not billed for this storage.
What is anomaly detection?
Anomaly detection enables you to monitor data quality across all tables in a schema. By analyzing historical patterns, Databricks automatically evaluates the completeness and freshness of each table. Results are available in Catalog Explorer.
Requirements
- Unity Catalog enabled workspace.
- Serverless compute must be available in your workspace (enabled by default in workspaces with Unity Catalog).
- To enable anomaly detection on a schema, you must have MANAGE SCHEMA or MANAGE CATALOG privileges on the catalog schema.
- To view the health indicator status of tables, you need SELECT or BROWSE privileges.
How does anomaly detection work?
Databricks creates a background job that monitors tables for freshness and completeness.
Freshness refers to how recently a table has been updated. Data quality monitoring analyzes the history of commits to a table and builds a per-table model to predict the time of the next commit. If a commit is unusually late, the table is marked as stale.
Completeness refers to the number of rows expected to be written to the table in the last 24 hours. Data quality monitoring analyzes the historical row count, and based on this data, predicts a range of expected number of rows. If the number of rows committed over the last 24 hours is less than the lower bound of this range, a table is marked as incomplete.
Databricks uses intelligent scanning to automate table scan frequencies. Intelligent scanning prioritizes high-impact tables as determined by popularity and downstream usage, and reduces frequency for less critical tables. To manually exclude tables, use the Create a Monitor or Update a Monitor API and specify the excluded tables in the excluded_table_full_names parameter. For more information, see the API documentation.
Anomaly detection does not modify any tables it monitors, nor does it add overhead to any jobs that populate these tables.
Event freshness, which is based on event time columns and ingestion latency, was available only to users of the data quality monitoring beta version. In the current version, event freshness is not supported.
Percent null for completeness
This feature is in Beta. Workspace admins can control access to this feature from the Previews page. See Manage Databricks previews.
Percent null adds additional quality details to completeness. Percent null is the percentage of rows written to the table in the last 24 hours expected to have null values for a given column. Data quality monitoring analyzes the historical trend for each column, and based on this data, predicts a range. If the percent null for a column over the last 24 hours is higher than the upper bound of this range, a table is marked as incomplete.
Cost
Anomaly detection runs on serverless compute and is billed as serverless DBUs under the DATA_QUALITY_MONITORING billing product. Cost scales with the number and size of the tables monitored in a schema. Intelligent scanning helps control cost by prioritizing important tables and skipping low-impact ones.
To view and track anomaly detection expenses, see Anomaly detection expenses.
Enable anomaly detection on a schema
To enable anomaly detection on a schema, navigate to the schema in Unity Catalog.
-
On the schema page, click the Details tab.
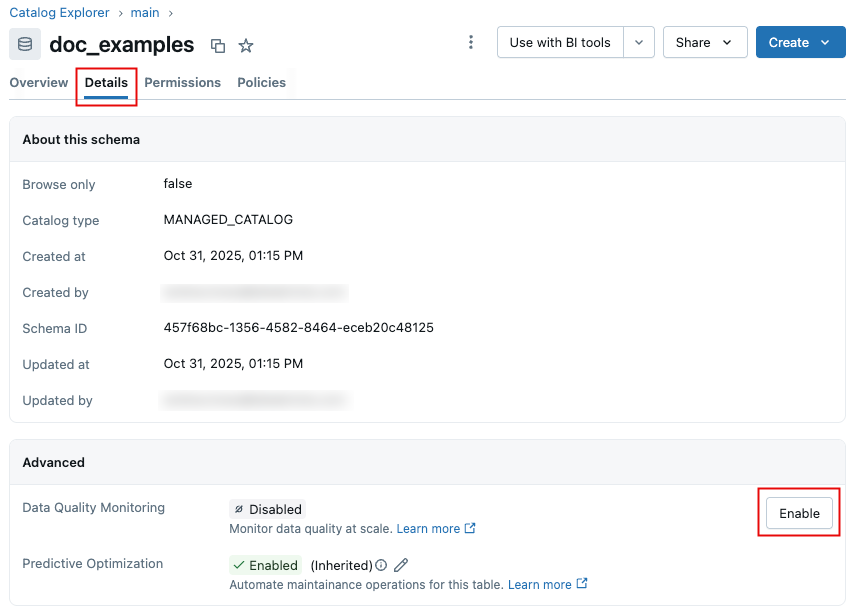
-
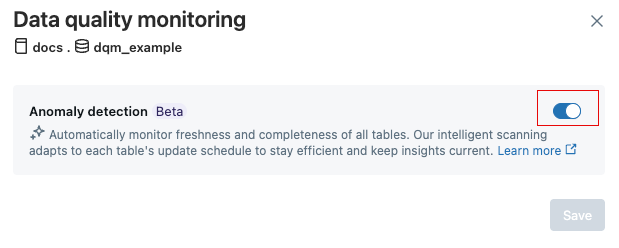
Click Enable. In the Data Quality Monitoring dialog, ensure that Anomaly detection is toggled on, then click Save.
-
A scan is initiated. Databricks automatically scans each table at the same frequency it’s updated, providing up-to-date insights without requiring manual configuration for each table. For schemas enabled prior to September 24, 2025, Databricks ran the monitor on historical data ("backtesting") for the first scan, to check the quality of your tables as if data quality monitoring had been enabled on your schema two weeks ago.
-
After the scan is complete, you can view anomaly detection results for your tables in the following ways:
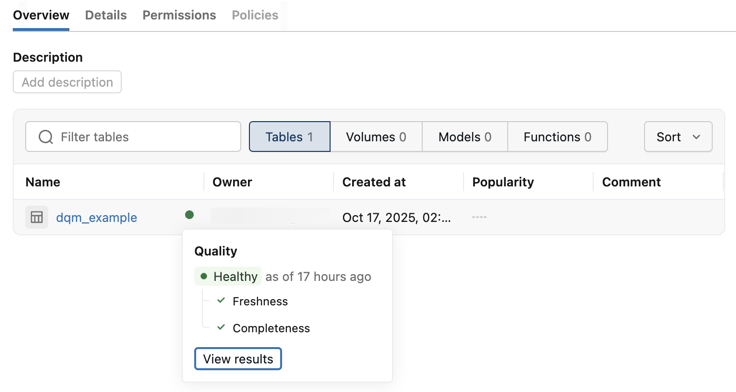
- Health indicators appear in Catalog Explorer for each table within a schema. See Health indicators.
- On the Details tab of a schema with Data Quality Monitoring enabled, click View results, and then view the results in Data Quality Monitoring. See View data quality monitoring results in the UI.
- Detected quality issues are logged in the output system table. See Review anomaly detection logged results.
Disable anomaly detection
To disable anomaly detection:
-
Click the pencil icon.
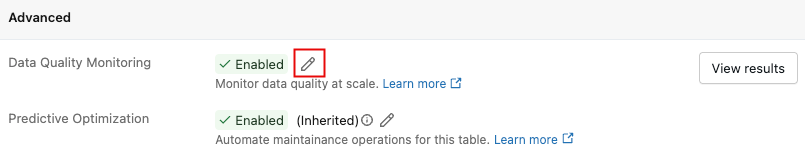
-
In the Data Quality Monitoring dialog, click the toggle.
importantWhen you disable anomaly detection, the anomaly detection job and all anomaly detection tables and information are deleted. This action cannot be undone.
-
Click Save.
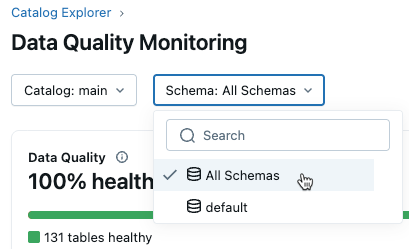
Health indicators
After you enable anomaly detection on a schema, health indicators appear on the schema and table overview pages in Catalog Explorer. The health indicator shows a summary of table health for data consumers and business users without requiring them to navigate to the Data Quality Monitoring UI. Users need the SELECT or BROWSE permission to view the health indicator status.
The following table describes each health indicator status:
Status | Description |
|---|---|
Healthy | All anomaly detection checks passed in the most recent scan. |
Unhealthy | One or more checks detected an anomaly, such as a freshness or completeness issue. |
Training | Anomaly detection is building a baseline model from historical data. Newly monitored tables display this status until the model has enough data to evaluate quality. |
Error | Anomaly detection encountered an error while monitoring this table. |
Excluded | The table is explicitly excluded from anomaly detection. |
Not enabled | Anomaly detection is not enabled on the schema containing this table. |
Smart scanning might delay the population of health indicators for some tables by up to two weeks if the table was skipped during the initial scan. The health indicator is populated on the next scheduled rescan.
View data quality monitoring results in the UI
On October 7, 2025, Databricks released a new version of the Data Quality Monitoring UI. Schemas enabled for data quality monitoring on or after that date automatically use this new UI. This section describes this latest version of the UI.
For information about the legacy UI, see Data quality dashboard (legacy).
Databricks recommends that you enable the new version for all of your existing schemas.
To enable the new version, click the Data Quality Monitoring toggle to turn off the feature, and then click again to turn it back on.
After you enable data quality monitoring on a schema, you can open the results page by clicking View results. You can also access results from all schemas that have monitoring enabled in Catalog Explorer.
The results UI contains catalog and schema dropdowns. When you select a catalog, the schema dropdown is populated with schemas in that catalog that have data quality monitoring enabled.
-
If you have MANAGE or SELECT privileges on the catalog, you can view incidents at the catalog level. To view all incidents in a catalog, select All Schemas from the Schema drop-down menu.
-
To view incidents for a specific schema, you must also have MANAGE or SELECT privileges on that schema. Selecting a schema then shows incidents for just that schema.
The results page shows a summary section at the top, which displays overall data quality for the selected scope, including the percentage of healthy tables and the percentage of schemas/tables currently monitored. Below this section is a table listing incidents across all monitored tables in the selected scope. Use the buttons to display Unhealthy, Healthy, or Error tables.
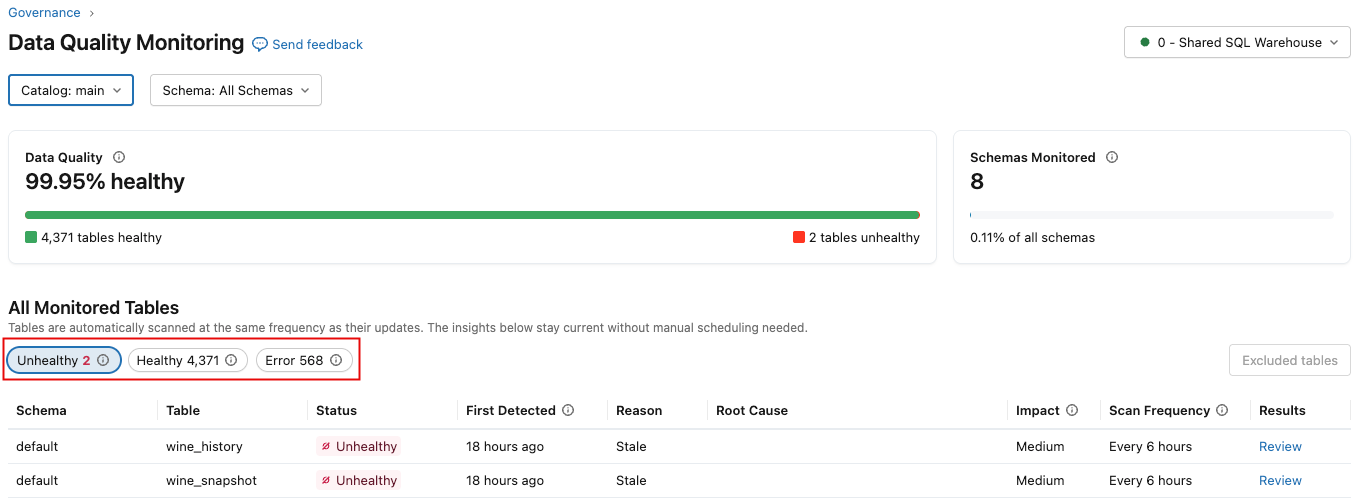
The following table describes the columns, which are slightly different depending on if you select Unhealthy, Healthy, or Error.
Column | Description |
|---|---|
Status |
|
First Detected | When the first incident was detected. Appears only in the Unhealthy tab. |
Last Scanned | When the table was last scanned. Appears only in the Healthy tab. |
Reason | Whether the table is unhealthy due to freshness or completeness. Appears only in the Unhealthy tab. |
Root Cause | Information about upstream jobs, pipelines, or tables contributing to the issue. Appears only in the Unhealthy tab. |
Impact | A qualitative measure of downstream impact (High, Medium, or Low), based on the number of downstream tables and queries affected. |
Scan Frequency | How frequently the table was scanned over the past week. |
Results | A link to the table quality page where you can view historical trends and visualizations explaining why an anomaly was detected. |
Error State | Error message. Appears only in the Error tab. |
Details | Details about the error message. Appears only in the Error tab. |
Manage unhealthy table incidents
From the Unhealthy tab, click Review in the Results column to open the incident details for the table. From this view, two actions are available:
- Assign to me: Claims ownership of the incident to indicate that it is actively being investigated. The table remains in an Unhealthy status. The assignment persists for 7 days.
- Not an issue: Marks the incident as a false positive and dismisses it. The table's status changes from Unhealthy to Healthy, and the Resolution column in the Recently Resolved Incidents section displays Not an issue. The dismissal persists for 7 days.

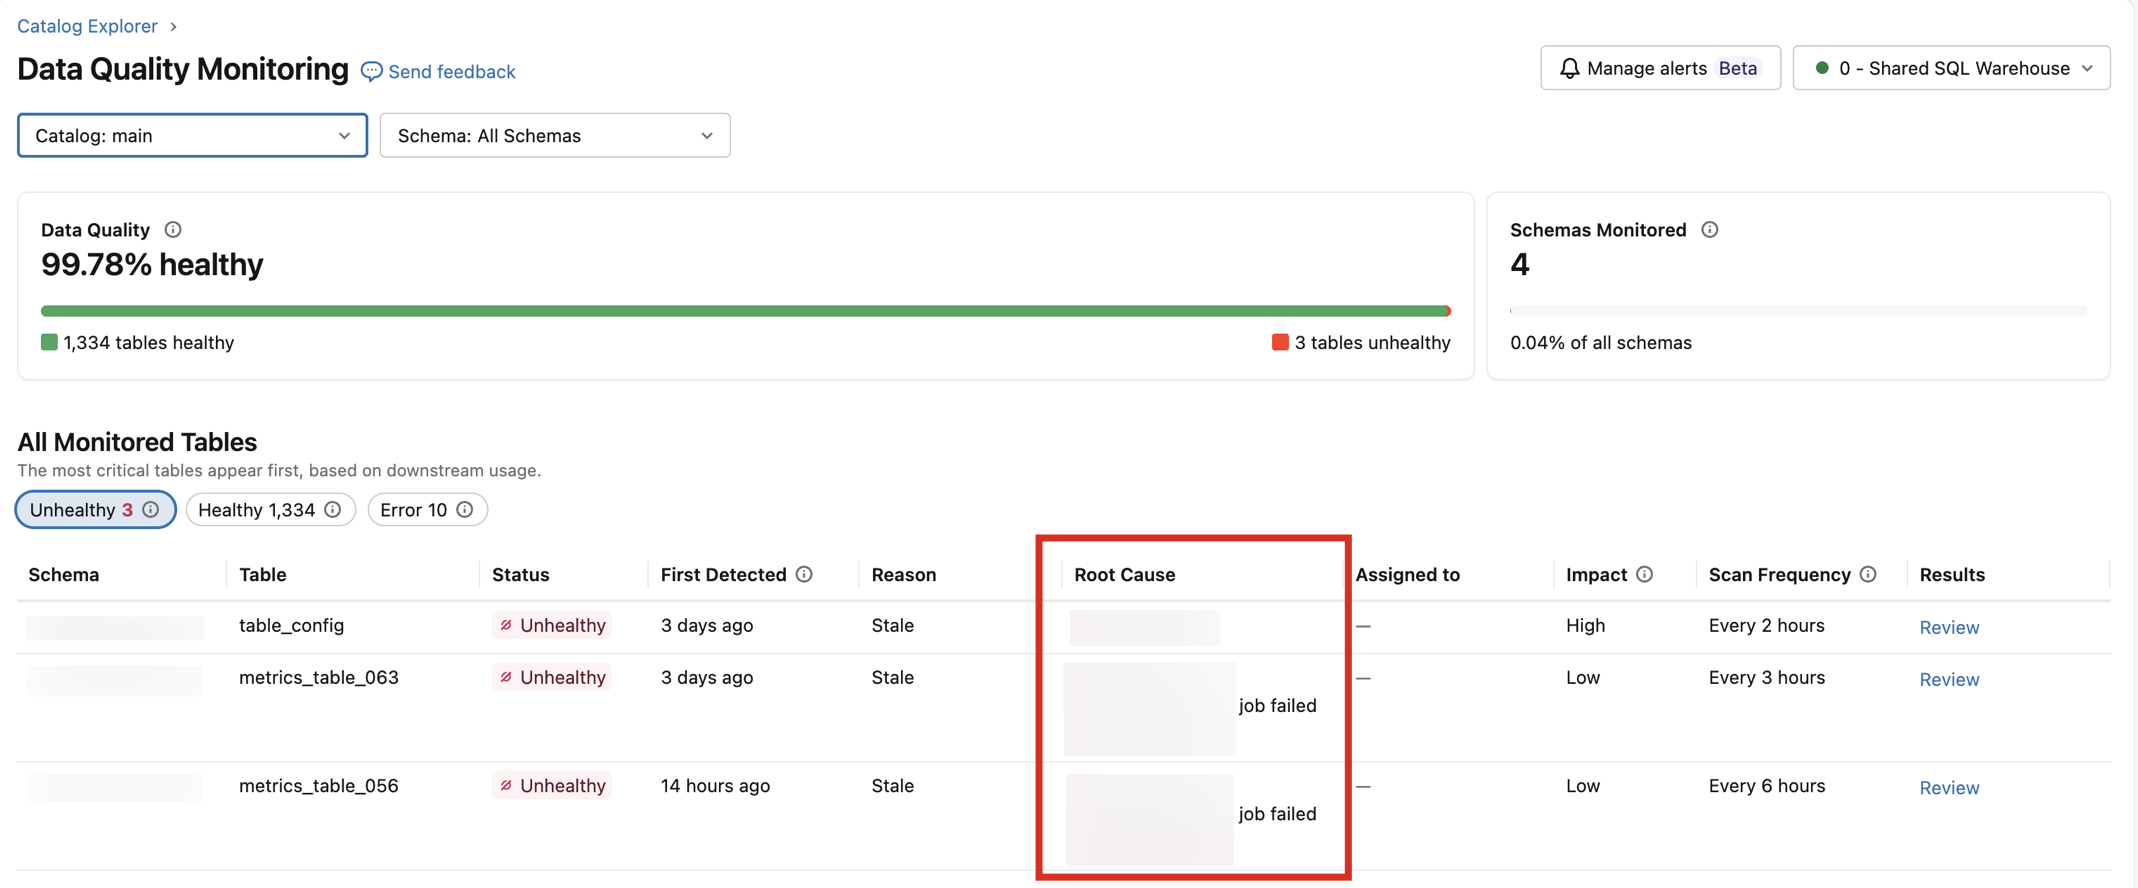
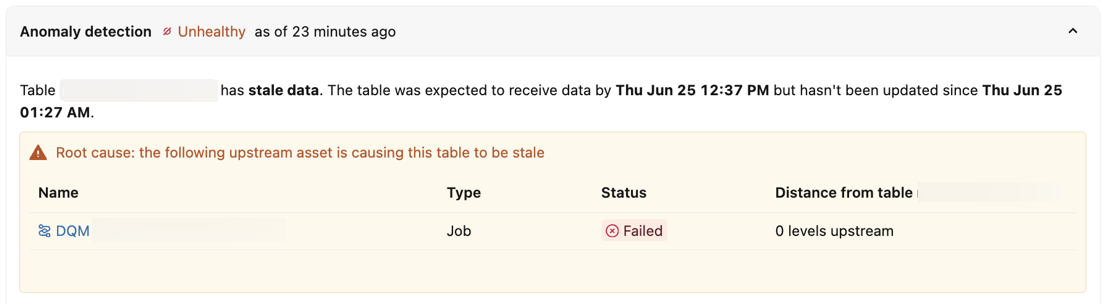
Root cause analysis
For each unhealthy table, anomaly detection identifies the most likely source of the quality problem. It analyzes the relationships between monitored assets to determine whether the problem originates in the table itself or in an upstream dependency. This analysis uses Unity Catalog data lineage to reason about multi-level relationships between assets.
When anomaly detection identifies a likely source, that source appears in the Root Cause column of the Unhealthy tab in the Data Quality Monitoring UI. The column shows the most likely reason for the issue, such as a job failure or upstream table health issue.
Root cause information is also available in alerts for anomaly detection. See Alerts for anomaly detection.
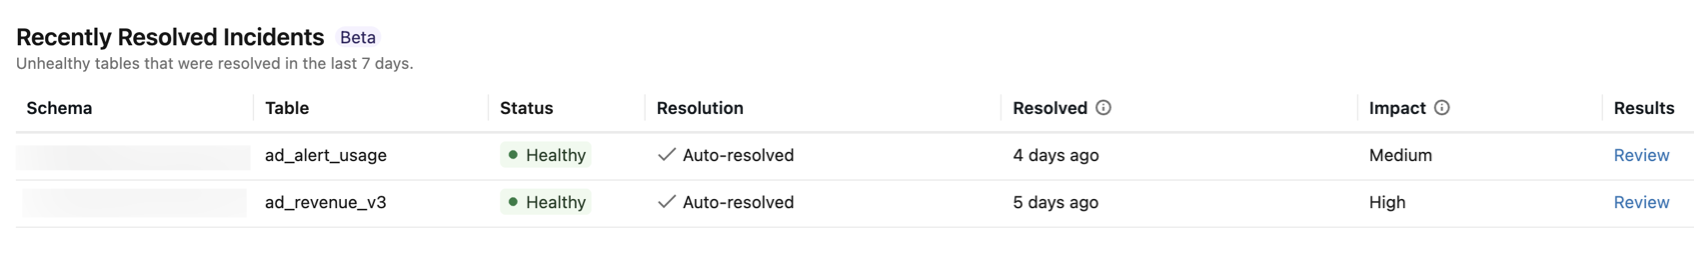
View recently resolved incidents
This feature is in Beta. Workspace admins can control access to this feature from the Previews page. See Manage Databricks previews.
The Recently Resolved Incidents section of the data quality monitoring dashboard shows tables that were previously unhealthy but have since recovered on their own. A table appears in this section when its status changes from Unhealthy to Healthy automatically, without manual intervention.
Monitoring recently auto-resolved incidents helps you identify self-healing data quality issues. Typically, these issues are transient problems such as upstream delays or staleness windows that resolve after fresh data arrives. Reviewing auto-resolved incidents helps you distinguish flaky issues from persistent problems and ensures that your tables remain healthy over time.
The following table describes the columns in this section:
Column | Description |
|---|---|
Schema | The schema containing the table. |
Table | The name of the table. |
Status | The current status of the table. Tables in this section always show Healthy. |
Resolution | How the incident was resolved. Shows Auto-resolved if the table recovered on its own, or Not an issue if a user dismissed the incident using the Not an issue action. |
Resolved | Time when the table's status last changed to Healthy. |
Impact | A qualitative measure of downstream impact (High, Medium, or Low), based on the number of downstream tables and queries affected. |
Results | A link to the table quality page where you can view historical trends and visualizations for the table. |
View metastore-level results
To view data quality results across your entire metastore, use one of the following:
- Data Quality Monitoring dashboard: A built-in dashboard that summarizes table health across all catalogs in the metastore.
- Dashboard template: A template that you import to build a dashboard from the results table.
Data Quality Monitoring dashboard
The Data Quality Monitoring dashboard summarizes table health across your metastore. To open it, click ![]() Catalog in the workspace sidebar, then select
Catalog in the workspace sidebar, then select ![]() Govern > Data Quality Monitoring.
Govern > Data Quality Monitoring.
Any user can view the dashboard. Results are scoped to the catalogs and tables that the user has permission to access.
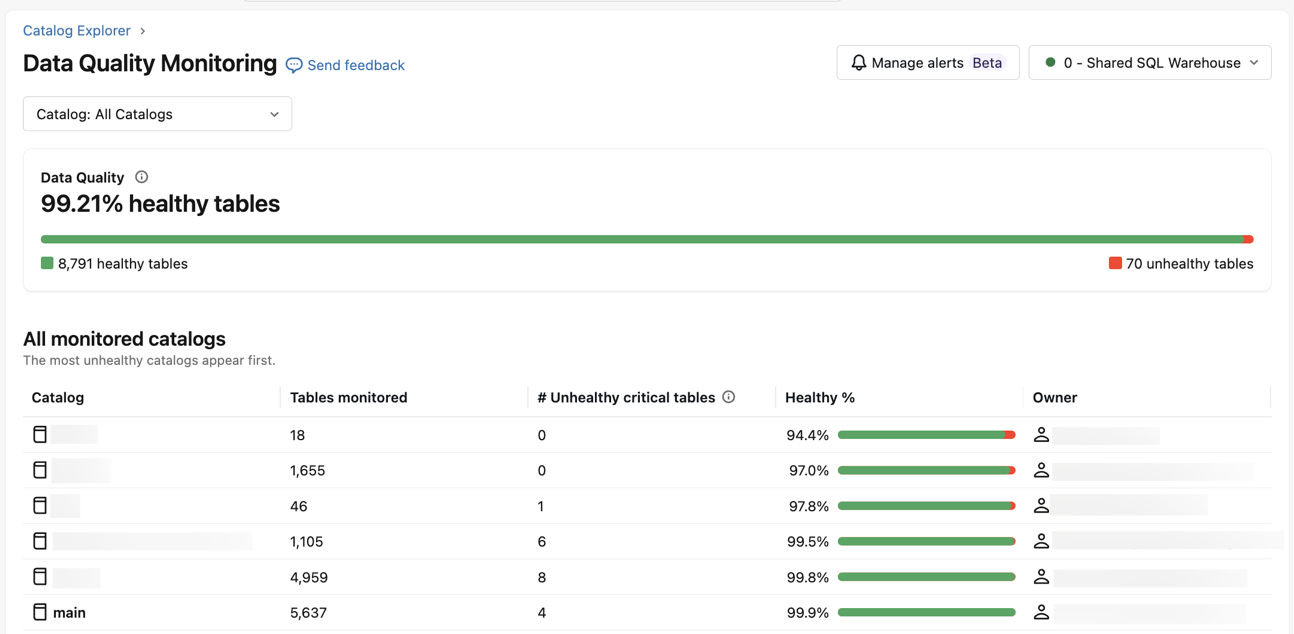
By default, the dashboard shows results for All Catalogs and includes:
- Data Quality: The percentage of healthy tables across the metastore, along with the total number of healthy and unhealthy tables.
- All monitored catalogs: A list of monitored catalogs, sorted with the most unhealthy catalogs first. For each catalog, the list shows the number of tables monitored, the number of unhealthy critical tables, the percentage of healthy tables, and the catalog owner.
To scope the results to a single catalog, select it from the Catalog drop-down menu.
Import a dashboard template
You can also import a template to your workspace. This template creates a dashboard that lets you view all quality results across the metastore.
To use this template, you must have access to the system.data_quality_monitoring.table_results table. By default, only account admins have access to this table. They can grant access to others as needed.
To import and use the template:
- Download the template file: metastore-quality-dashboard.lvdash.json.
- In the workspace sidebar, click
 Dashboards.
 - In the upper-right corner, select Import dashboard from file from the Create dashboard drop-down menu.
- In the dialog, click Choose file, navigate to the template file, and click Import dashboard.
The file is imported and the dashboard appears.
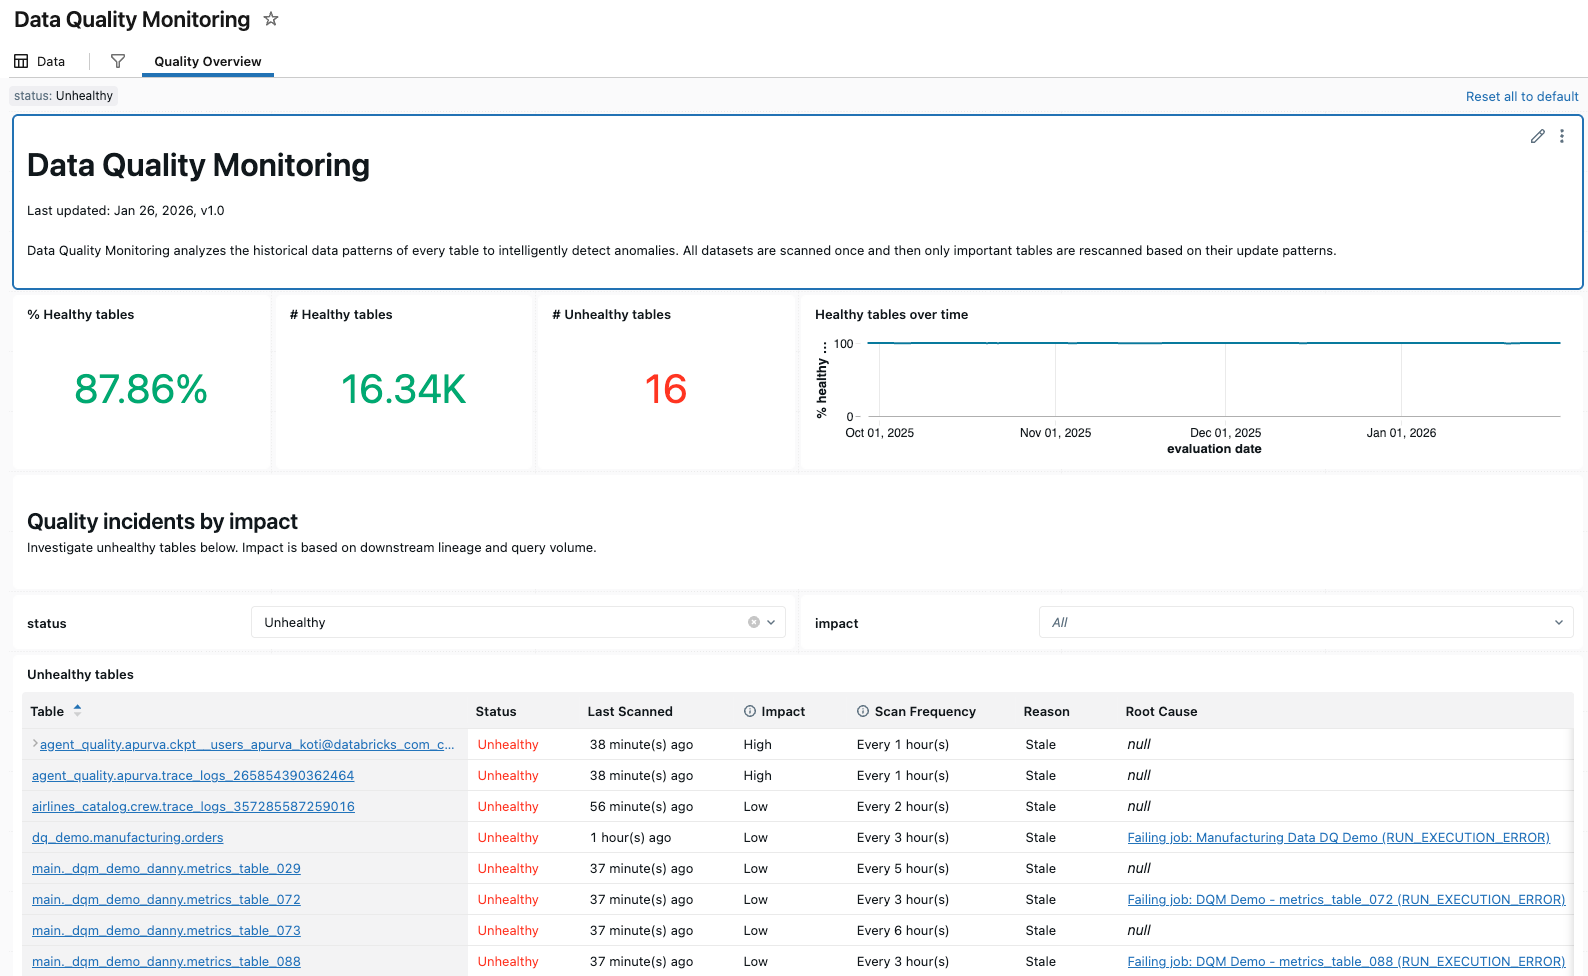
Table quality details
The Table Quality Details UI allows you to dive deeper into trends and understand why anomalies were detected for specific tables in your schema. You can access this view in several ways:
- From the Results UI (new experience), by clicking on the review link in the incidents list.
- From the Monitoring Dashboard (legacy Lakeview dashboard), by clicking on the table name in the Quality Overview tab.
- From the UC Table viewer, by visiting the Quality tab on the table page.
All options take you to the same Table Quality Details view for the selected table.
Given a table, the UI shows summaries from each quality check for the table, with graphs of predicted and observed values at each evaluation timestamp. The graphs plot results from the last 1 week of data.
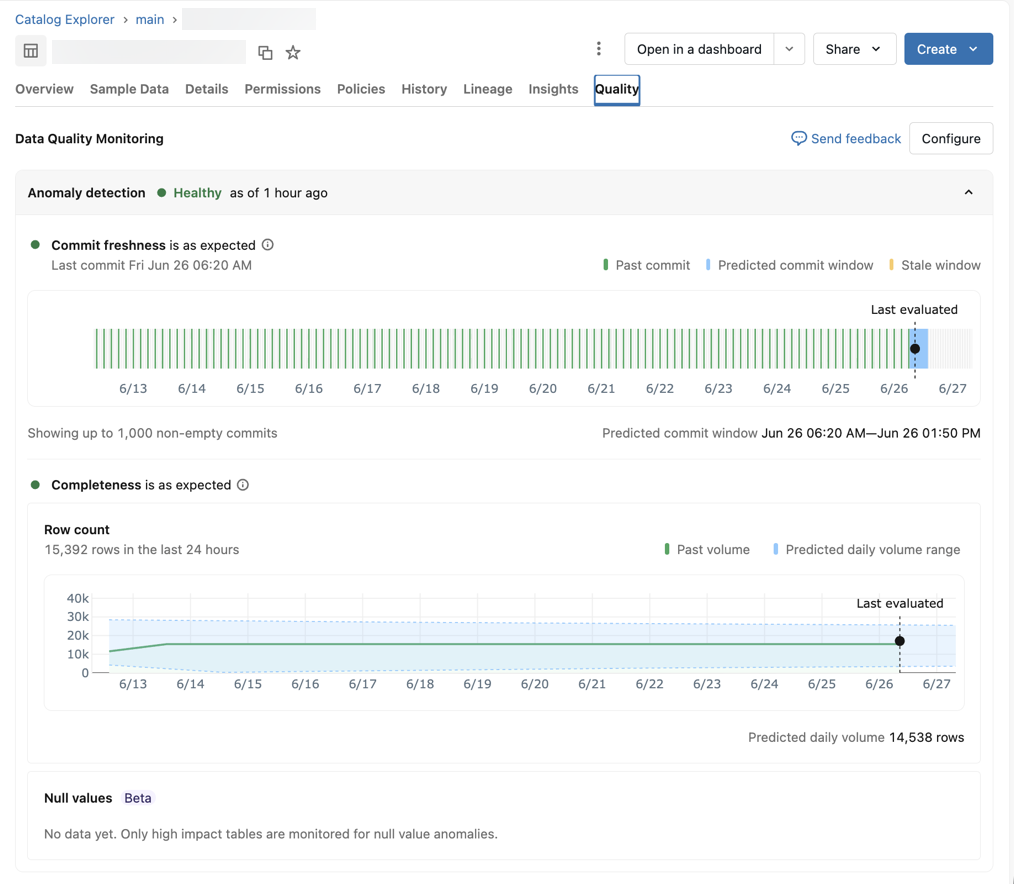
If the table failed the quality checks, the UI also displays any upstream jobs that were identified as the root cause.
Set up alerts
To configure a Databricks SQL alert on the output results table, see Alerts for anomaly detection.
Limitations
- Anomaly detection does not support views or foreign tables.
- The determination of completeness does not take into account metrics such as the fraction of nulls, zero values, or NaN.
Legacy anomaly detection
The following sections cover two legacy features: the data quality dashboard and anomaly detection job configuration. The current version of anomaly detection does not include these features. The dashboard has been replaced by the data quality monitoring results UI.
Data quality dashboard (legacy)
Data quality dashboard (legacy)
The data quality monitoring dashboard was available only to legacy users. In the current version, use View data quality monitoring results in the UI.
The first data quality monitor run creates a dashboard to summarize results and trends derived from the logging table. The dashboard is automatically populated with insights for the scanned schema. A single dashboard is created per workspace at this path: /Shared/Databricks Quality Monitoring/Data Quality Monitoring.
Quality overview
The Quality Overview tab shows a summary of the latest quality status of tables in your schema based on the most recent evaluation.
To get started, you must enter the logging table for the schema you want to analyze to populate the dashboard.
The top section of the dashboard shows an overview of the results of the scan.
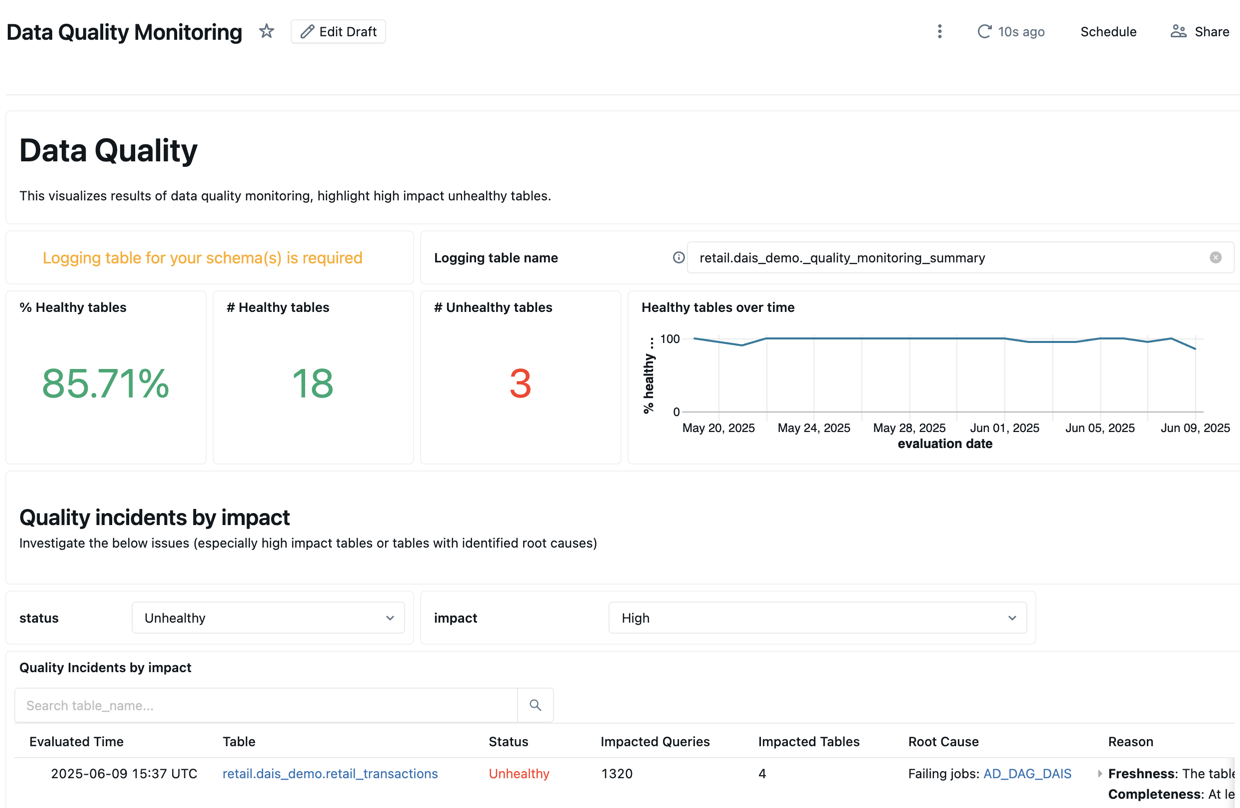
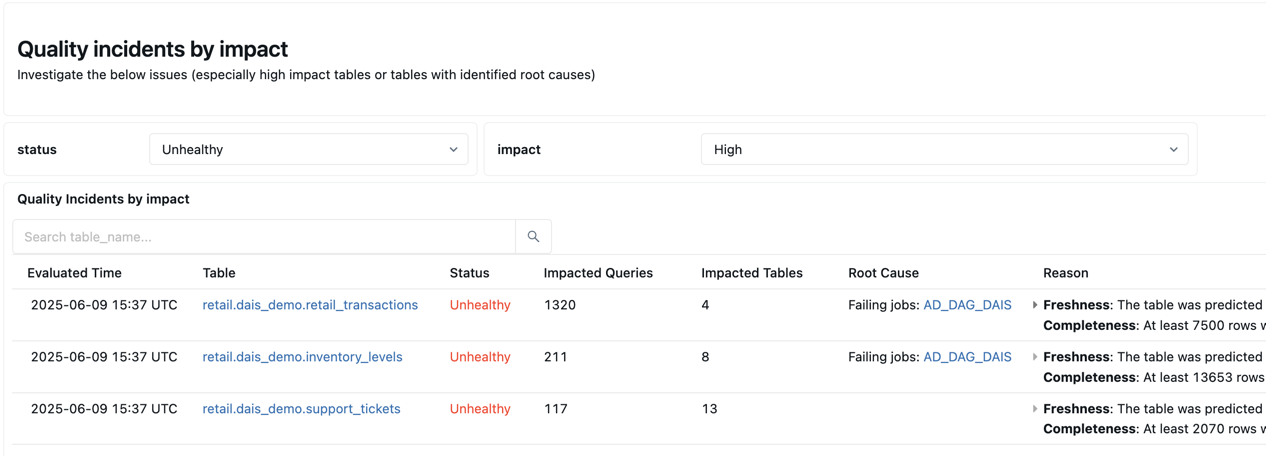
Below the summary is a table listing quality incidents by impact. Any identified root causes are displayed in the root_cause_analysis column.
Below the quality incident table is a table of identified static tables that have not been updated in a long time.
Set parameters for freshness and completeness evaluation (legacy)
Set parameters for freshness and completeness evaluation (legacy)
Starting from July 21, 2025, configuration of the job parameters is not supported for new customers. If you need to configure the job settings, contact Databricks.
To edit the parameters that control the job, such as how often the job runs or the name of the logged results table, you must edit the job parameters on the Tasks tab of the job page.
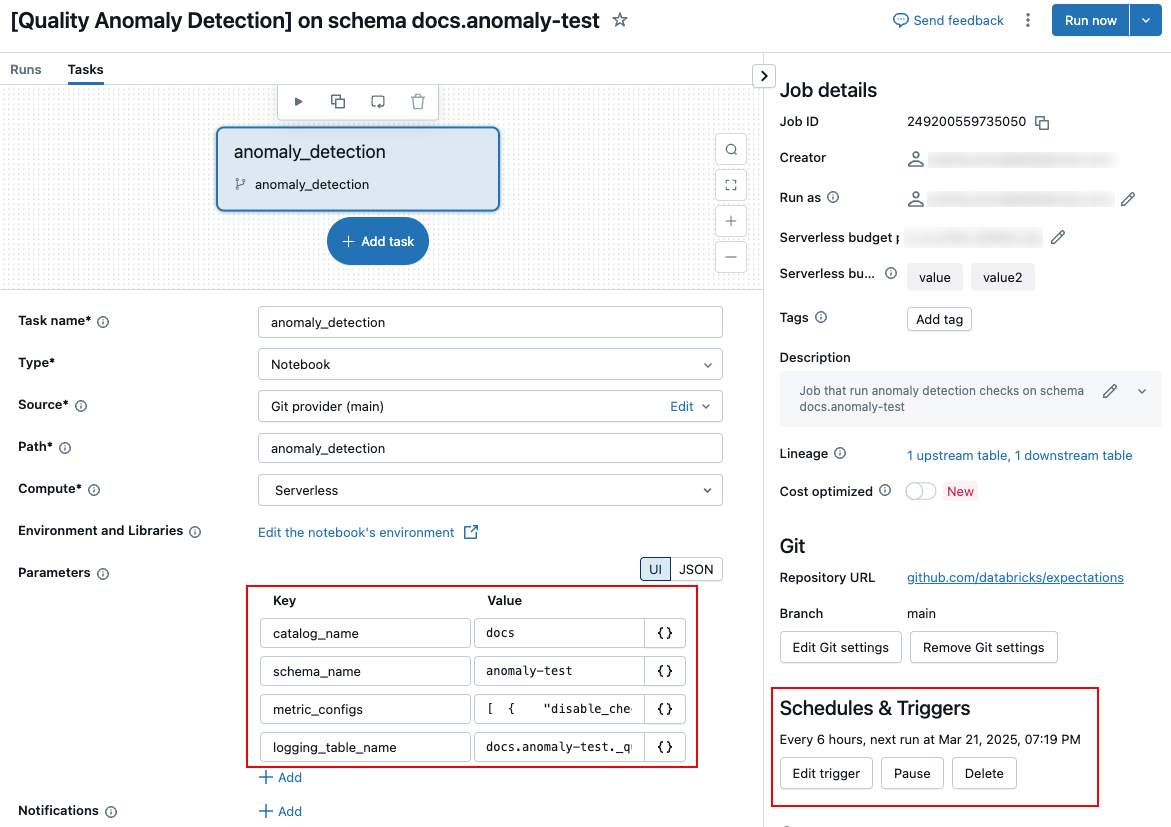
The following sections describe specific settings. For information about how to set task parameters, see Configure task parameters.
Schedule and notifications (legacy)
To customize the schedule for the job, or to set up notifications, use the Schedules & Triggers settings on the jobs page. See Automate jobs with schedules and triggers.
Name of logging table (legacy)
To change the name of the logging table, or save the table in a different schema, edit the job task parameter logging_table_name and specify the desired name. To save the logging table in a different schema, specify the full 3-level name.
Customize freshness and completeness evaluations (legacy)
All of the parameters in this section are optional. By default, anomaly detection determines thresholds based on an analysis of the table's history.
These parameters are fields inside the task parameter metric_configs. The format of metric_configs is a JSON string with the following default values:
[
  {
    "disable_check": false,
    "tables_to_skip": null,
    "tables_to_scan": null,
    "table_threshold_overrides": null,
    "table_latency_threshold_overrides": null,
    "static_table_threshold_override": null,
    "event_timestamp_col_names": null,
    "metric_type": "FreshnessConfig"
  },
  {
    "disable_check": true,
    "tables_to_skip": null,
    "tables_to_scan": null,
    "table_threshold_overrides": null,
    "metric_type": "CompletenessConfig"
  }
]
The following parameters can be used for both freshness and completeness evaluations.
Field name | Description | Example |
|---|---|---|
| Only the specified tables are scanned. |
|
| The specified tables are skipped during the scan. |
|
| Scan is not run. Use this parameter if you want to disable only the |
|
The following parameters apply only to the freshness evaluation:
Field name | Description | Example |
|---|---|---|
| List of timestamp columns tables in your schema might have. If a table has one of these columns, it is marked |
|
| A dictionary consisting of table names and thresholds (in seconds) that specify the maximum interval since the last table update before marking a table as |
|
| A dictionary consisting of table names and latency thresholds (in seconds) that specify the maximum interval since the last timestamp in the table before marking a table as |
|
| Amount of time (in seconds) before a table is considered as a static table (that is, one that is no longer updated). |
|
The following parameter applies only to the completeness evaluation:
Field name | Description | Example |
|---|---|---|
| A dictionary consisting of table names and row volume thresholds (specified as integers). If the number of rows added to a table over the previous 24 hours is less than the specified threshold, the table is marked |
|