Track runs with MLflow and the Jobs run page
This feature is in Public Preview.
Each workload you submit with air run is both a Databricks job run and an MLflow run:
- The job run (visible on the workspace Jobs & Pipelines page) tracks execution: status, compute, retries, and driver output.
- The MLflow run tracks the experiment: parameters, metrics, system metrics, and artifacts.
One submission creates one job run and one MLflow run. A retry creates a new MLflow run.
Experiments and runs
Two workload YAML fields control how the run appears in MLflow:
experiment_name: my-training # Creates or appends to this MLflow experiment
mlflow_run_name: baseline-lr3e5 # Names the MLflow run for this submission
compute:
  num_accelerators: 8
  accelerator_type: GPU_8xH100
command: torchrun --nproc_per_node=8 train.py
max_retries: 2
experiment_name(Required): Creates an MLflow experiment with this name if one doesn't exist, or appends a new run to the existing experiment. An experiment holds many runs.mlflow_run_name(Optional): Sets the run name. If omitted, the run name defaults to the experiment name (experiment_name).max_retries(Optional): Each retry attempt is a new MLflow run in the same experiment, so you can compare attempts. The original submission and its retries share one job run.
Navigate between Jobs, MLflow, and previous workloads
You can get to a run from three places:
- Jobs: The Jobs run page lists your runs, and each run links to its MLflow run and experiment.
- MLflow: The Experiments page lists your MLflow experiments.
- Previous workloads:
air get run <job-run-id>prints clickable links to the run's job, experiment, and MLflow run.air list runslists your previous runs and lets you filter to find a specific run.
air get run <job-run-id> # Links to the job, experiment, and MLflow run
air list runs # List previous runs; filter to find a specific run
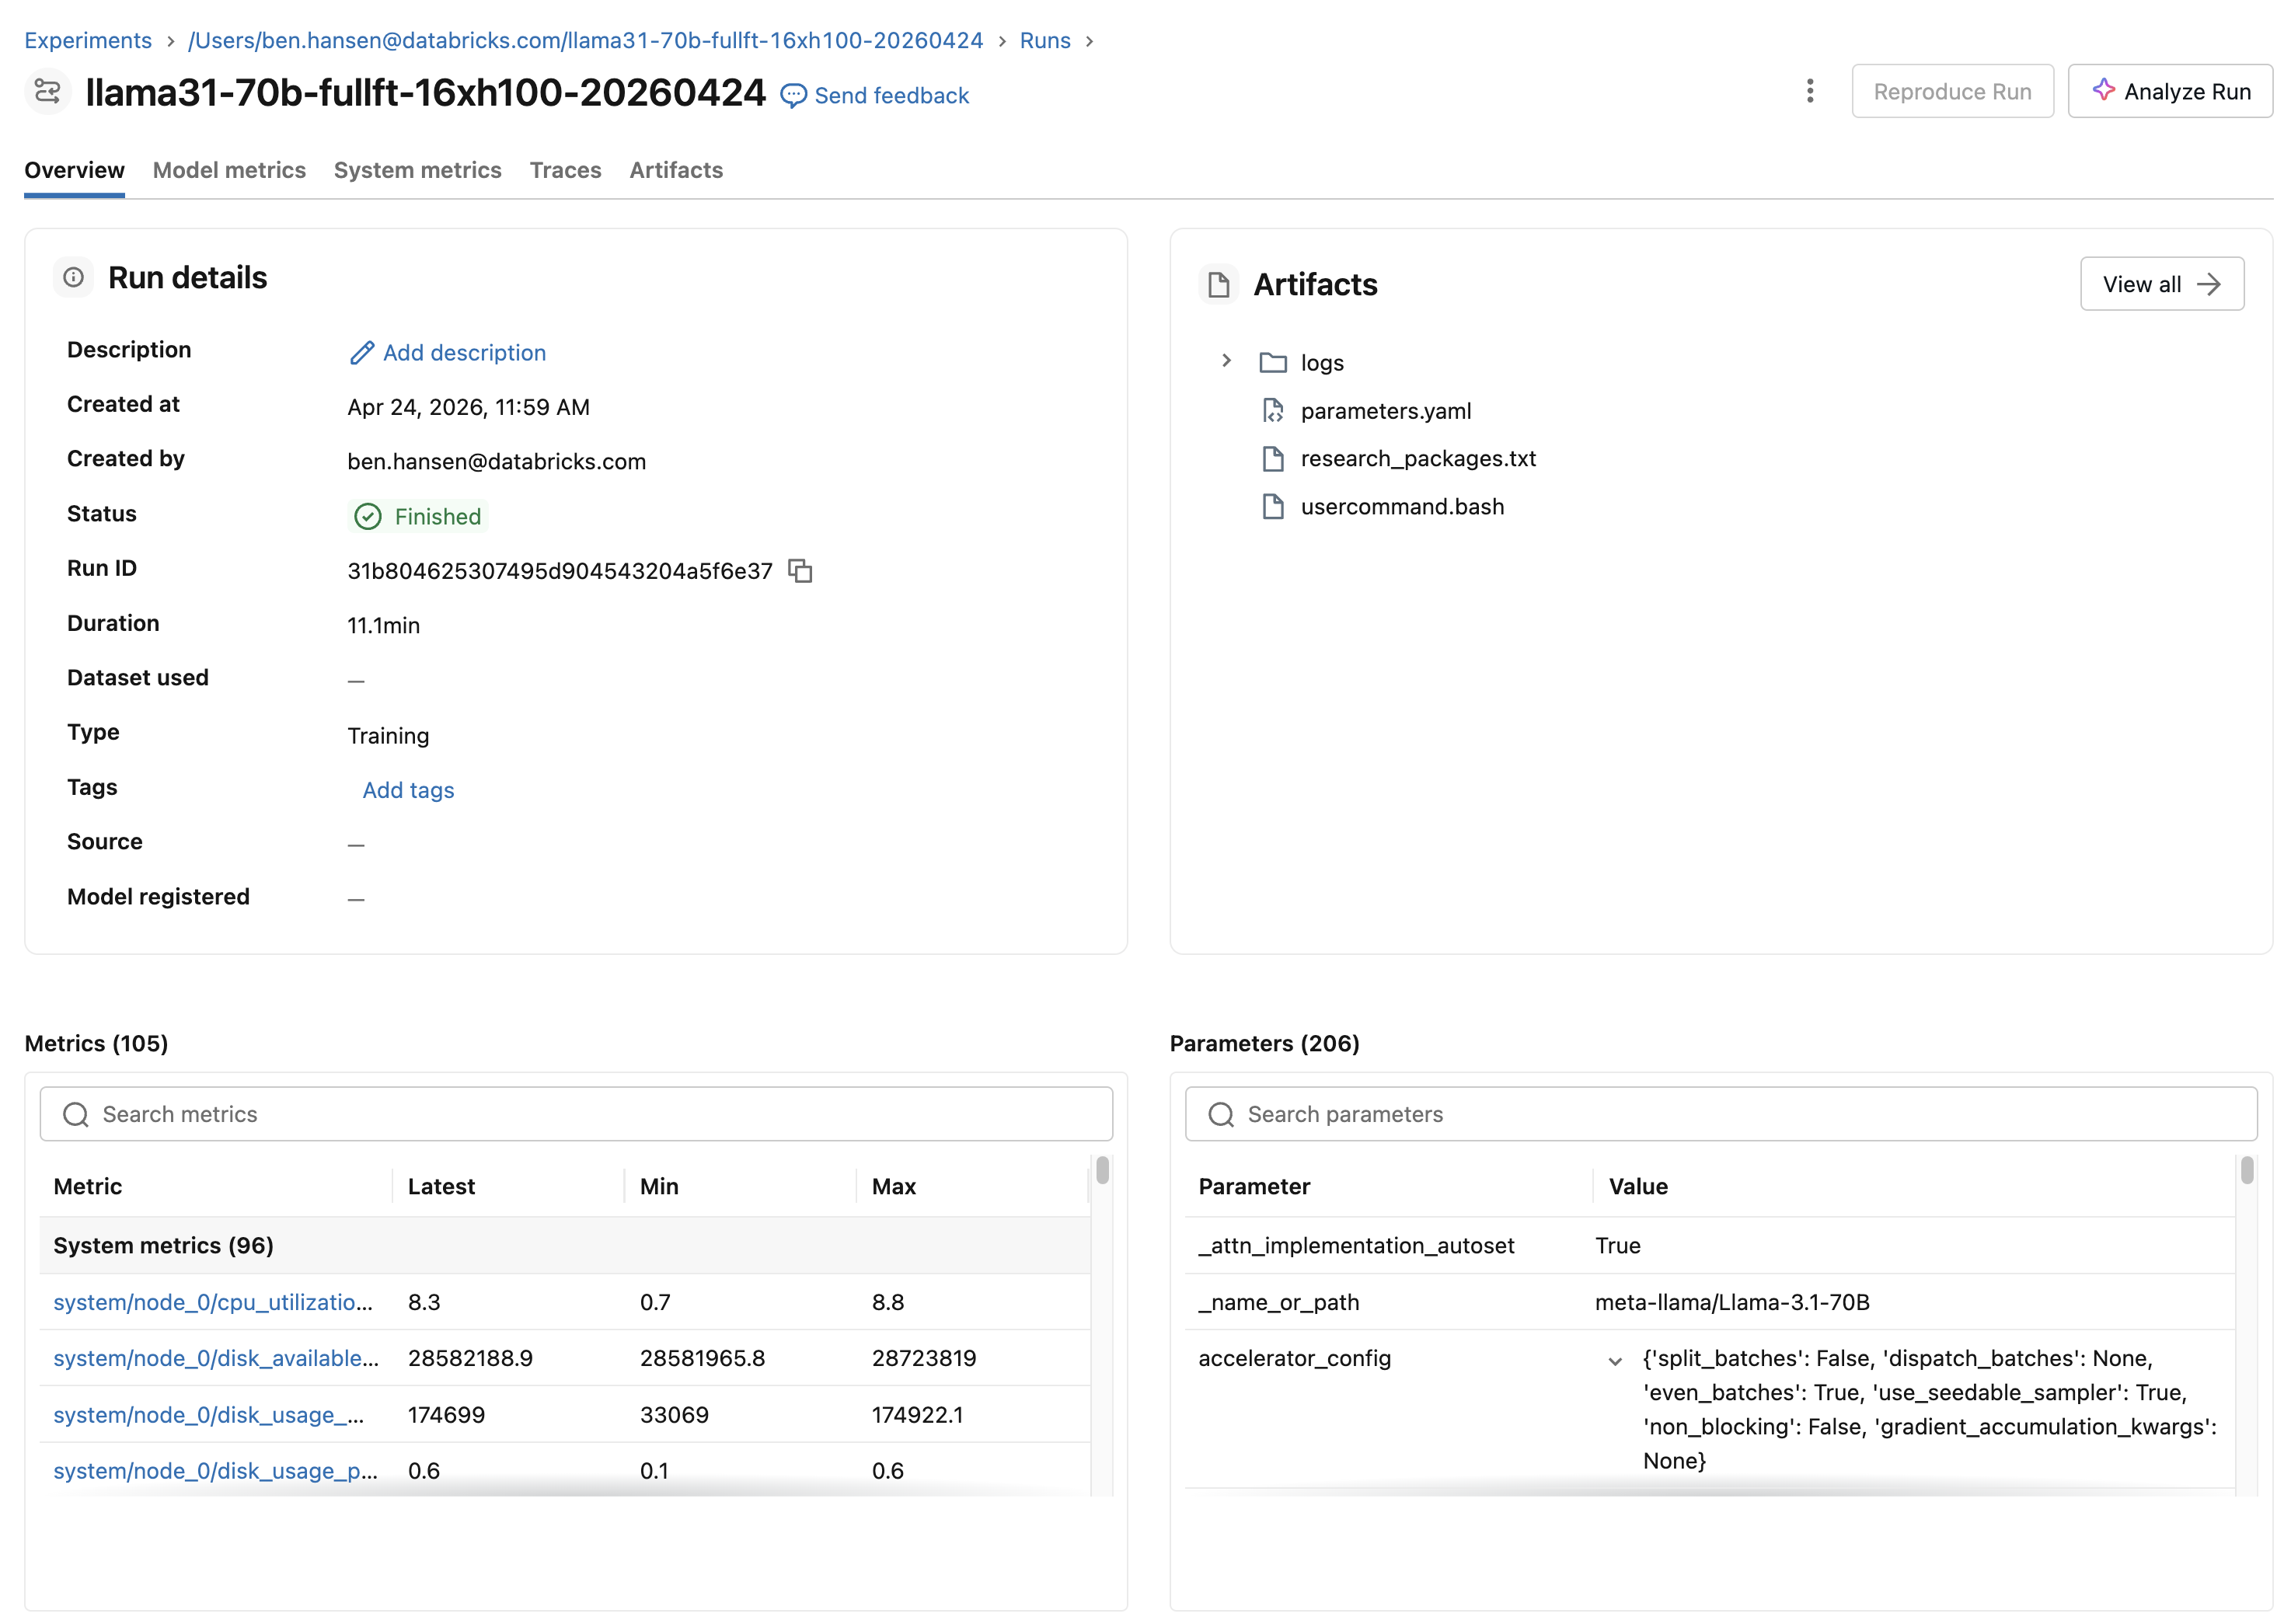
System metrics
GPU, CPU, and memory system metrics are captured automatically for every run. No configuration is required. View them on the MLflow run's System metrics tab.

Log custom metrics
The platform creates the MLflow run and exposes its ID to your training process through the MLFLOW_RUN_ID environment variable. Use the MLflow tracking API to log your own parameters, metrics, and artifacts to that run.
On distributed (multi-node) workloads, every node shares the same MLflow run. Log from the rank-0 process only, so each metric is recorded once:
import os

import mlflow

# Log from rank 0 only; all nodes share the same MLFLOW_RUN_ID.
if os.environ.get("RANK", "0") == "0":
    with mlflow.start_run(run_id=os.environ["MLFLOW_RUN_ID"]):
        mlflow.log_param("learning_rate", 3e-4)
        for step, loss in enumerate(training_losses):
            mlflow.log_metric("train_loss", loss, step=step)
Logs and artifacts
Stream or download a run's logs with air logs:
air logs <job-run-id> # Stream logs from node 0
air logs <job-run-id> --node 2 # Logs from a specific node
air logs <job-run-id> --download-to ./logs/ # Download instead of streaming
Logs are also available as artifacts on the MLflow run. To persist model checkpoints, write them to a Unity Catalog volume. For checkpointing patterns and managing volumes, see Experiment tracking and observability.