Experiment tracking and observability
This feature is in Public Preview.
Experiment tracking and observability are built into AI Runtime. MLflow is a single place for a run's parameters, metrics, GPU system metrics, logs, and artifacts. Every run lives in an MLflow experiment that you can share with your team, and a built-in GPU resources pane shows live GPU utilization, memory, and temperature while your code runs.
Key points on this page:
- MLflow is the unified interface for AI Runtime experiments: metrics, parameters, system metrics, logs, and artifacts.
- Workloads submitted with the Databricks CLI get an MLflow run automatically. In notebooks and scripts, call
mlflow.start_run()ormlflow.autolog(). - A built-in GPU resources pane shows utilization, memory, and temperature.
What MLflow provides for deep learning
- Metrics and parameters: Log training loss, evaluation metrics, learning rate, and hyperparameters, and compare them across runs in the MLflow UI.
- System metrics: GPU, CPU, and memory utilization recorded alongside your training metrics on the run's System metrics tab.
- Logs: Driver output from the job run on the run's Logs tab.
- Artifacts and models: Store model files, configs, and other outputs with the run. Artifacts can be stored in a Unity Catalog volume.
- Sharing and collaboration: Experiments are workspace objects. Grant teammates access to an experiment to share runs and compare results. See Organize training runs with MLflow experiments.
- Framework integrations: Hugging Face Transformers, PyTorch Lightning, and other libraries log to MLflow directly.
For deep learning patterns in MLflow 3, see MLflow 3 deep learning workflow.
Do I need to add MLflow code?
It depends on how you submit the workload:
How you run | MLflow run created automatically? | What you add |
|---|---|---|
Databricks CLI ( | Yes. | Optional. Log custom metrics to the run in |
Serverless GPU API ( | Yes. Each | Optional. Log custom metrics from inside the function. |
Notebook or script on a single node | No. Autologging isn't enabled automatically on serverless compute. | Call |
Getting started
Use MLflow 3.7 and above. The following examples are ready to copy into a notebook cell or a Python script.
Log metrics from a training loop
import mlflow

mlflow.set_experiment("/Users/<username>/my-experiment")

with mlflow.start_run(run_name="baseline-lr3e-4"):
    mlflow.log_params({"learning_rate": 3e-4, "batch_size": 32, "epochs": 3})
    for epoch in range(3):
        train_loss = train_one_epoch(model, train_loader, optimizer)  # your training code
        val_loss = evaluate(model, val_loader)
        mlflow.log_metrics({"train_loss": train_loss, "val_loss": val_loss}, step=epoch)
Use autologging
For PyTorch Lightning, call mlflow.pytorch.autolog() before training. For other supported libraries, call mlflow.autolog().
import mlflow

mlflow.pytorch.autolog()

with mlflow.start_run(run_name="lightning-baseline"):
    trainer.fit(model, datamodule=datamodule)
Log from Hugging Face Transformers
Set report_to="mlflow". The run_name argument sets the MLflow run name.
from transformers import TrainingArguments

args = TrainingArguments(
    output_dir="/Volumes/<catalog>/<schema>/<volume>/checkpoints",
    report_to="mlflow",
    run_name="llama7b-sft-lr3e5",
    logging_steps=50,
)
Log from multiple GPUs
In distributed training, every process runs your training code. Log from rank 0 only so each metric is recorded one time:
import os

import mlflow

if int(os.environ.get("RANK", "0")) == 0:
    mlflow.log_metric("train_loss", loss, step=step)
Best practices
- Set
stepto a meaningful value such as the global batch or epoch, and log at an interval (for example, every 50 steps) instead of every batch. MLflow caps the number of metric steps per run. See Resource limits. - Use absolute experiment paths, such as
/Users/<username>/my-experimentor/Workspace/Shared/<team>/my-experiment. Put experiments you want to share in a shared folder. - To resume a previous run, pass its ID:
mlflow.start_run(run_id="<previous-run-id>").
Serverless GPU API
When you use the Serverless GPU API, each call to .distributed() automatically creates an MLflow run. The default experiment is /Users/{WORKSPACE_USER}/{notebook-name}.
-
If you call
.distributed()inside an active MLflow run, it creates a nested child run under that run:Pythonimport mlflow
with mlflow.start_run() as outer_run:
run_train.distributed() # creates a nested child run under outer_run -
To use a different experiment, call
mlflow.set_experiment()before.distributed(), or set theMLFLOW_EXPERIMENT_NAMEenvironment variable. Always use absolute paths.Pythonimport os
import mlflow
mlflow.set_experiment("/Users/<username>/my-experiment")
# or: os.environ["MLFLOW_EXPERIMENT_NAME"] = "/Users/<username>/my-experiment"
run_train.distributed() -
To resume a previous run, set
MLFLOW_RUN_IDbefore calling.distributed():Pythonos.environ["MLFLOW_RUN_ID"] = "<previous-run-id>"
run_train.distributed()
Viewing logs
- Notebook output: Standard output and errors from your training code appear in the notebook cell output.
- MLflow logs: The MLflow experiment UI displays training metrics, parameters, and artifacts.
If you can't view logs
The Logs tab on the MLflow run page streams logs from the Databricks job run associated with the MLflow run, so access is governed by that job's permissions. If the tab shows You don't have access to these logs, you don't have sufficient permissions.
Access to the run in MLflow doesn't imply access to the job. You can hold the MLflow experiment permission and still be denied the logs. To get access, ask a user with Can Manage permissions or a workspace admin to grant you at least Can View on the job. See Control access to a job for how job permissions are granted.
Monitor GPU resources
The GPU resources pane is a convenience feature for notebook sessions. It shows live GPU health and utilization without any MLflow setup, so it's especially useful when your notebook session doesn't create an MLflow experiment. For a persistent record of GPU, CPU, and memory metrics tied to a run, use the MLflow System metrics tab instead. The pane supports both single-node and multi-node workloads.
To open the pane, connect your notebook to AI Runtime, then click  GPU resources in the right side pane.
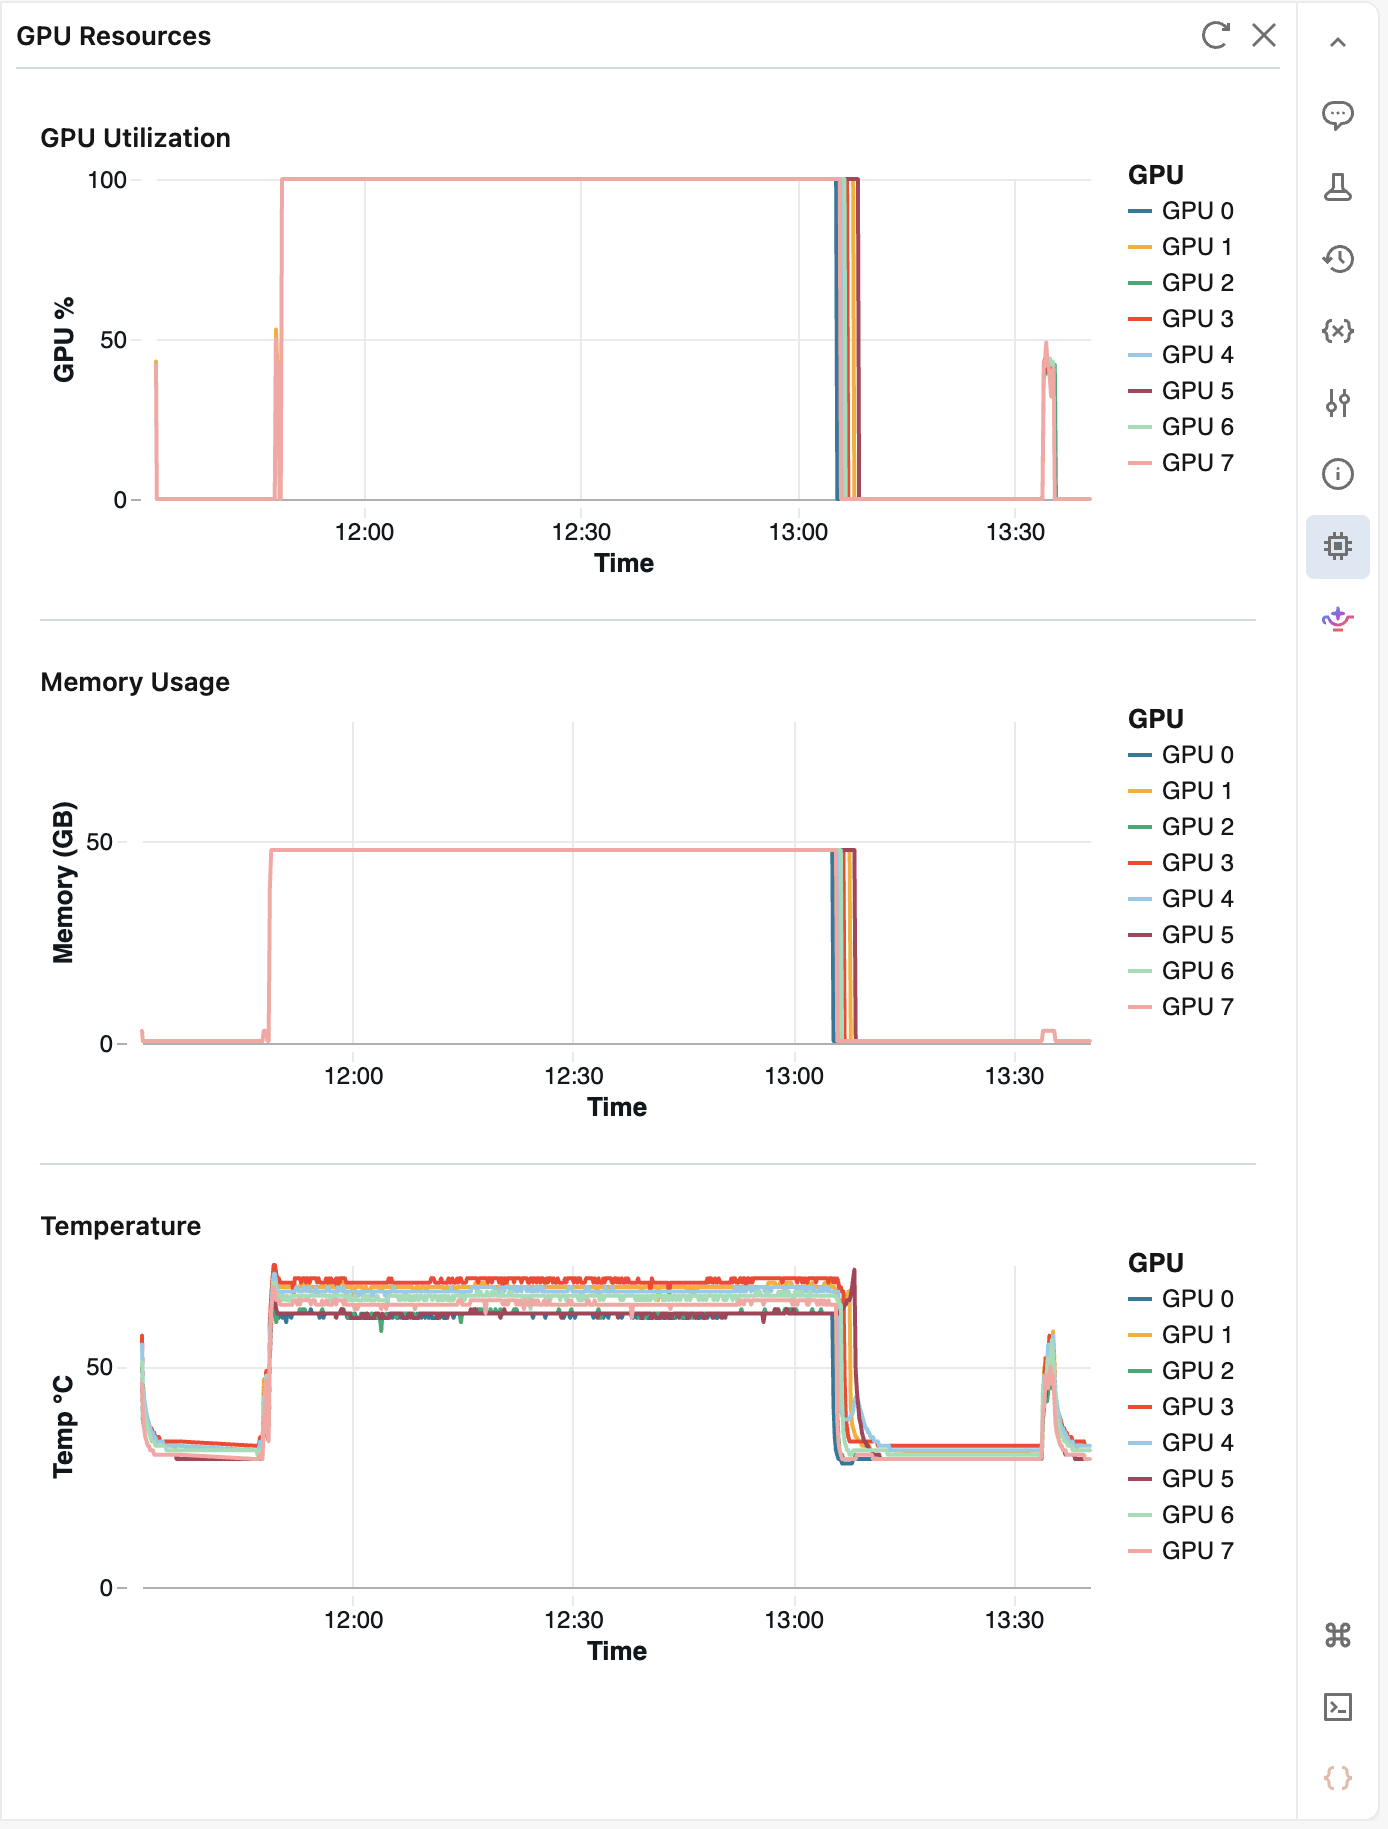
The pane displays the following metrics for each GPU:
- GPU utilization percentage
- GPU memory usage
- Temperature
The pane polls metrics every 10 seconds and retains up to 2 hours of history. Click  Refresh to fetch the latest values immediately. After 5 minutes of inactivity, the pane pauses; reopen it to resume monitoring.
Global limits in Databricks
See Resource limits.