Tracing Gemini
MLflow Tracing provides automatic tracing capability for Google Gemini. By enabling auto tracing
for Gemini by calling the mlflow.gemini.autolog function, MLflow will capture nested traces and log them to the active MLflow Experiment upon invocation of Gemini Python SDK.
import mlflow

mlflow.gemini.autolog()
MLflow trace automatically captures the following information about Gemini calls:
- Prompts and completion responses
- Latencies
- Model name
- Additional metadata such as
temperature,max_tokens, if specified. - Function calling if returned in the response
- Any exception if raised
On serverless compute clusters, autologging is not automatically enabled. You must explicitly call mlflow.gemini.autolog() to enable automatic tracing for this integration.
Currently, MLflow Gemini integration only supports tracing of synchronous calls for text interactions. Async APIs are not traced and full inputs may not be recorded for multi-modal inputs.
Basic Example
import mlflow
import google.genai as genai
import os

# Turn on auto tracing for Gemini
mlflow.gemini.autolog()

# Set up MLflow tracking on Databricks
mlflow.set_tracking_uri("databricks")
mlflow.set_experiment("/Shared/gemini-demo")


# Configure the SDK with your API key.
client = genai.Client(api_key=os.environ["GEMINI_API_KEY"])

# Use the generate_content method to generate responses to your prompts.
response = client.models.generate_content(
    model="gemini-1.5-flash", contents="The opposite of hot is"
)
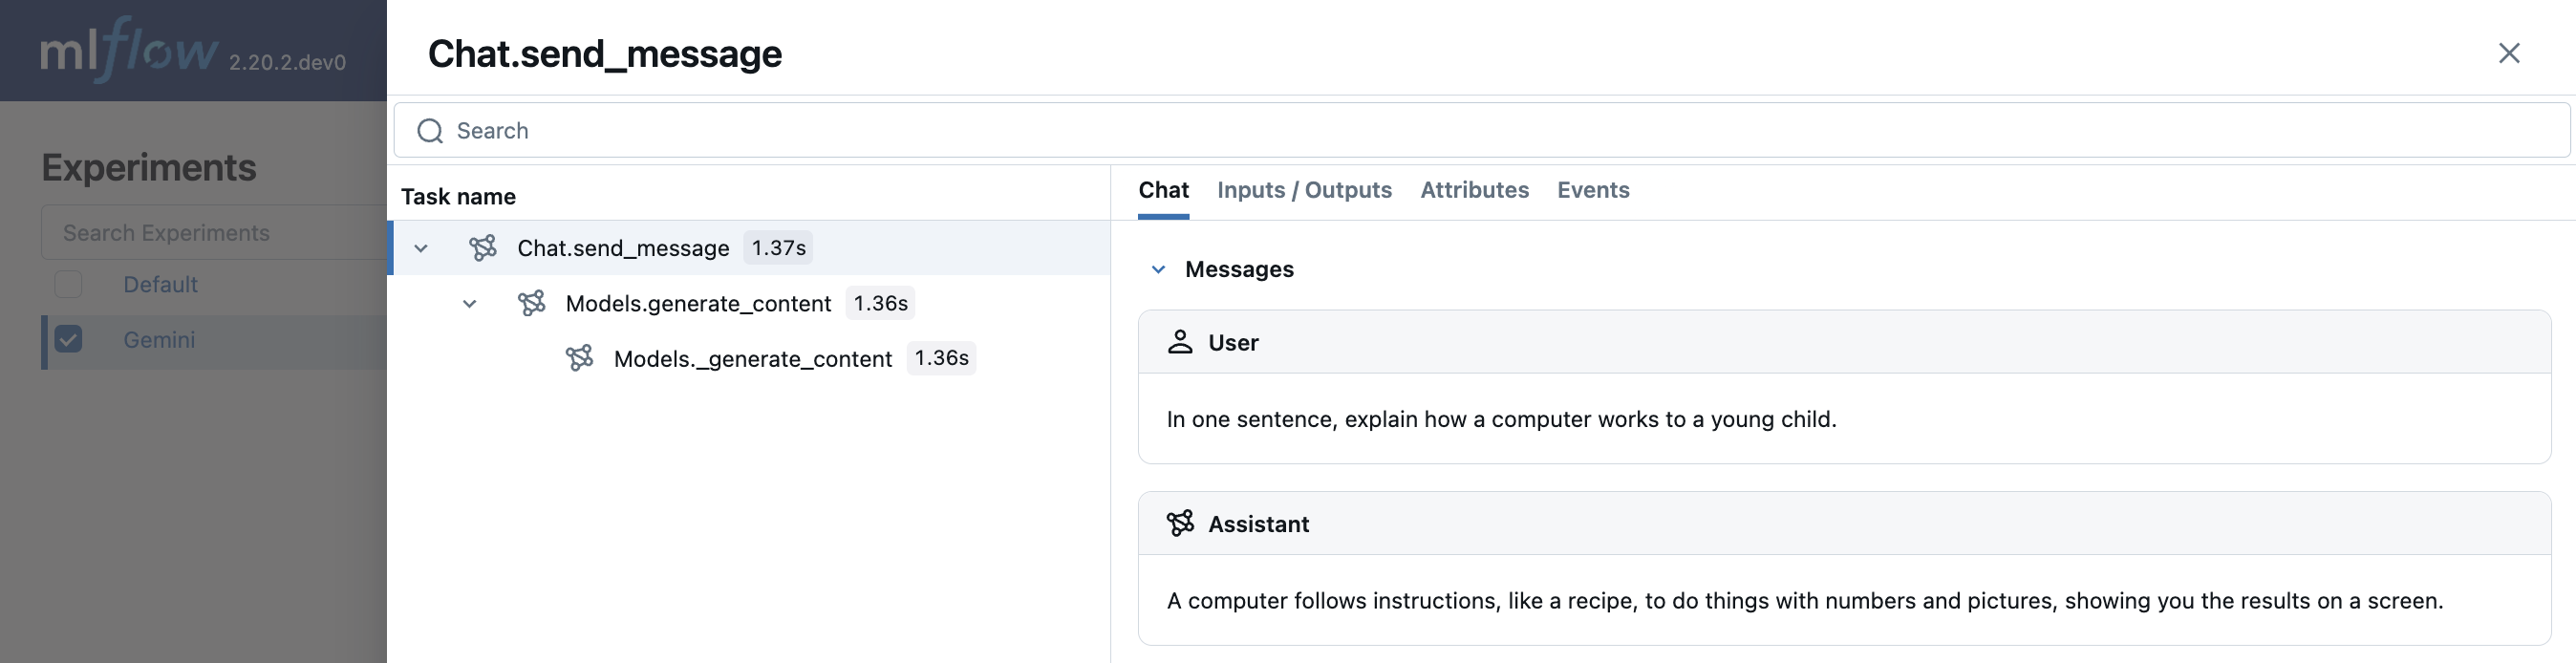
Multi-turn chat interactions
MLflow support tracing multi-turn conversations with Gemini:
import mlflow

mlflow.gemini.autolog()

chat = client.chats.create(model='gemini-1.5-flash')
response = chat.send_message("In one sentence, explain how a computer works to a young child.")
print(response.text)
response = chat.send_message("Okay, how about a more detailed explanation to a high schooler?")
print(response.text)
Embeddings
MLflow Tracing for Gemini SDK supports embeddings API:
result = client.models.embed_content(model="text-embedding-004", contents="Hello world")
Disable auto-tracing
Auto tracing for Gemini can be disabled globally by calling mlflow.gemini.autolog(disable=True) or mlflow.autolog(disable=True).
Additional resources
- Understand tracing concepts - Learn how MLflow captures and organizes trace data
- Debug and observe your app - Use the Trace UI to analyze your Gemini application's behavior
- Evaluate your app's quality - Set up quality assessment for your Gemini-powered application