Observe and find issues
Coding agent quickstart
Using a coding agent? Paste this prompt:
Read the documentation at https://docs.databricks.com/aws/en/mlflow3/genai/tracing/observe-with-traces and help me query and analyze my agent's traces to find quality issues.
Optionally, install mlflow/skills for a deeper integration with MLflow.
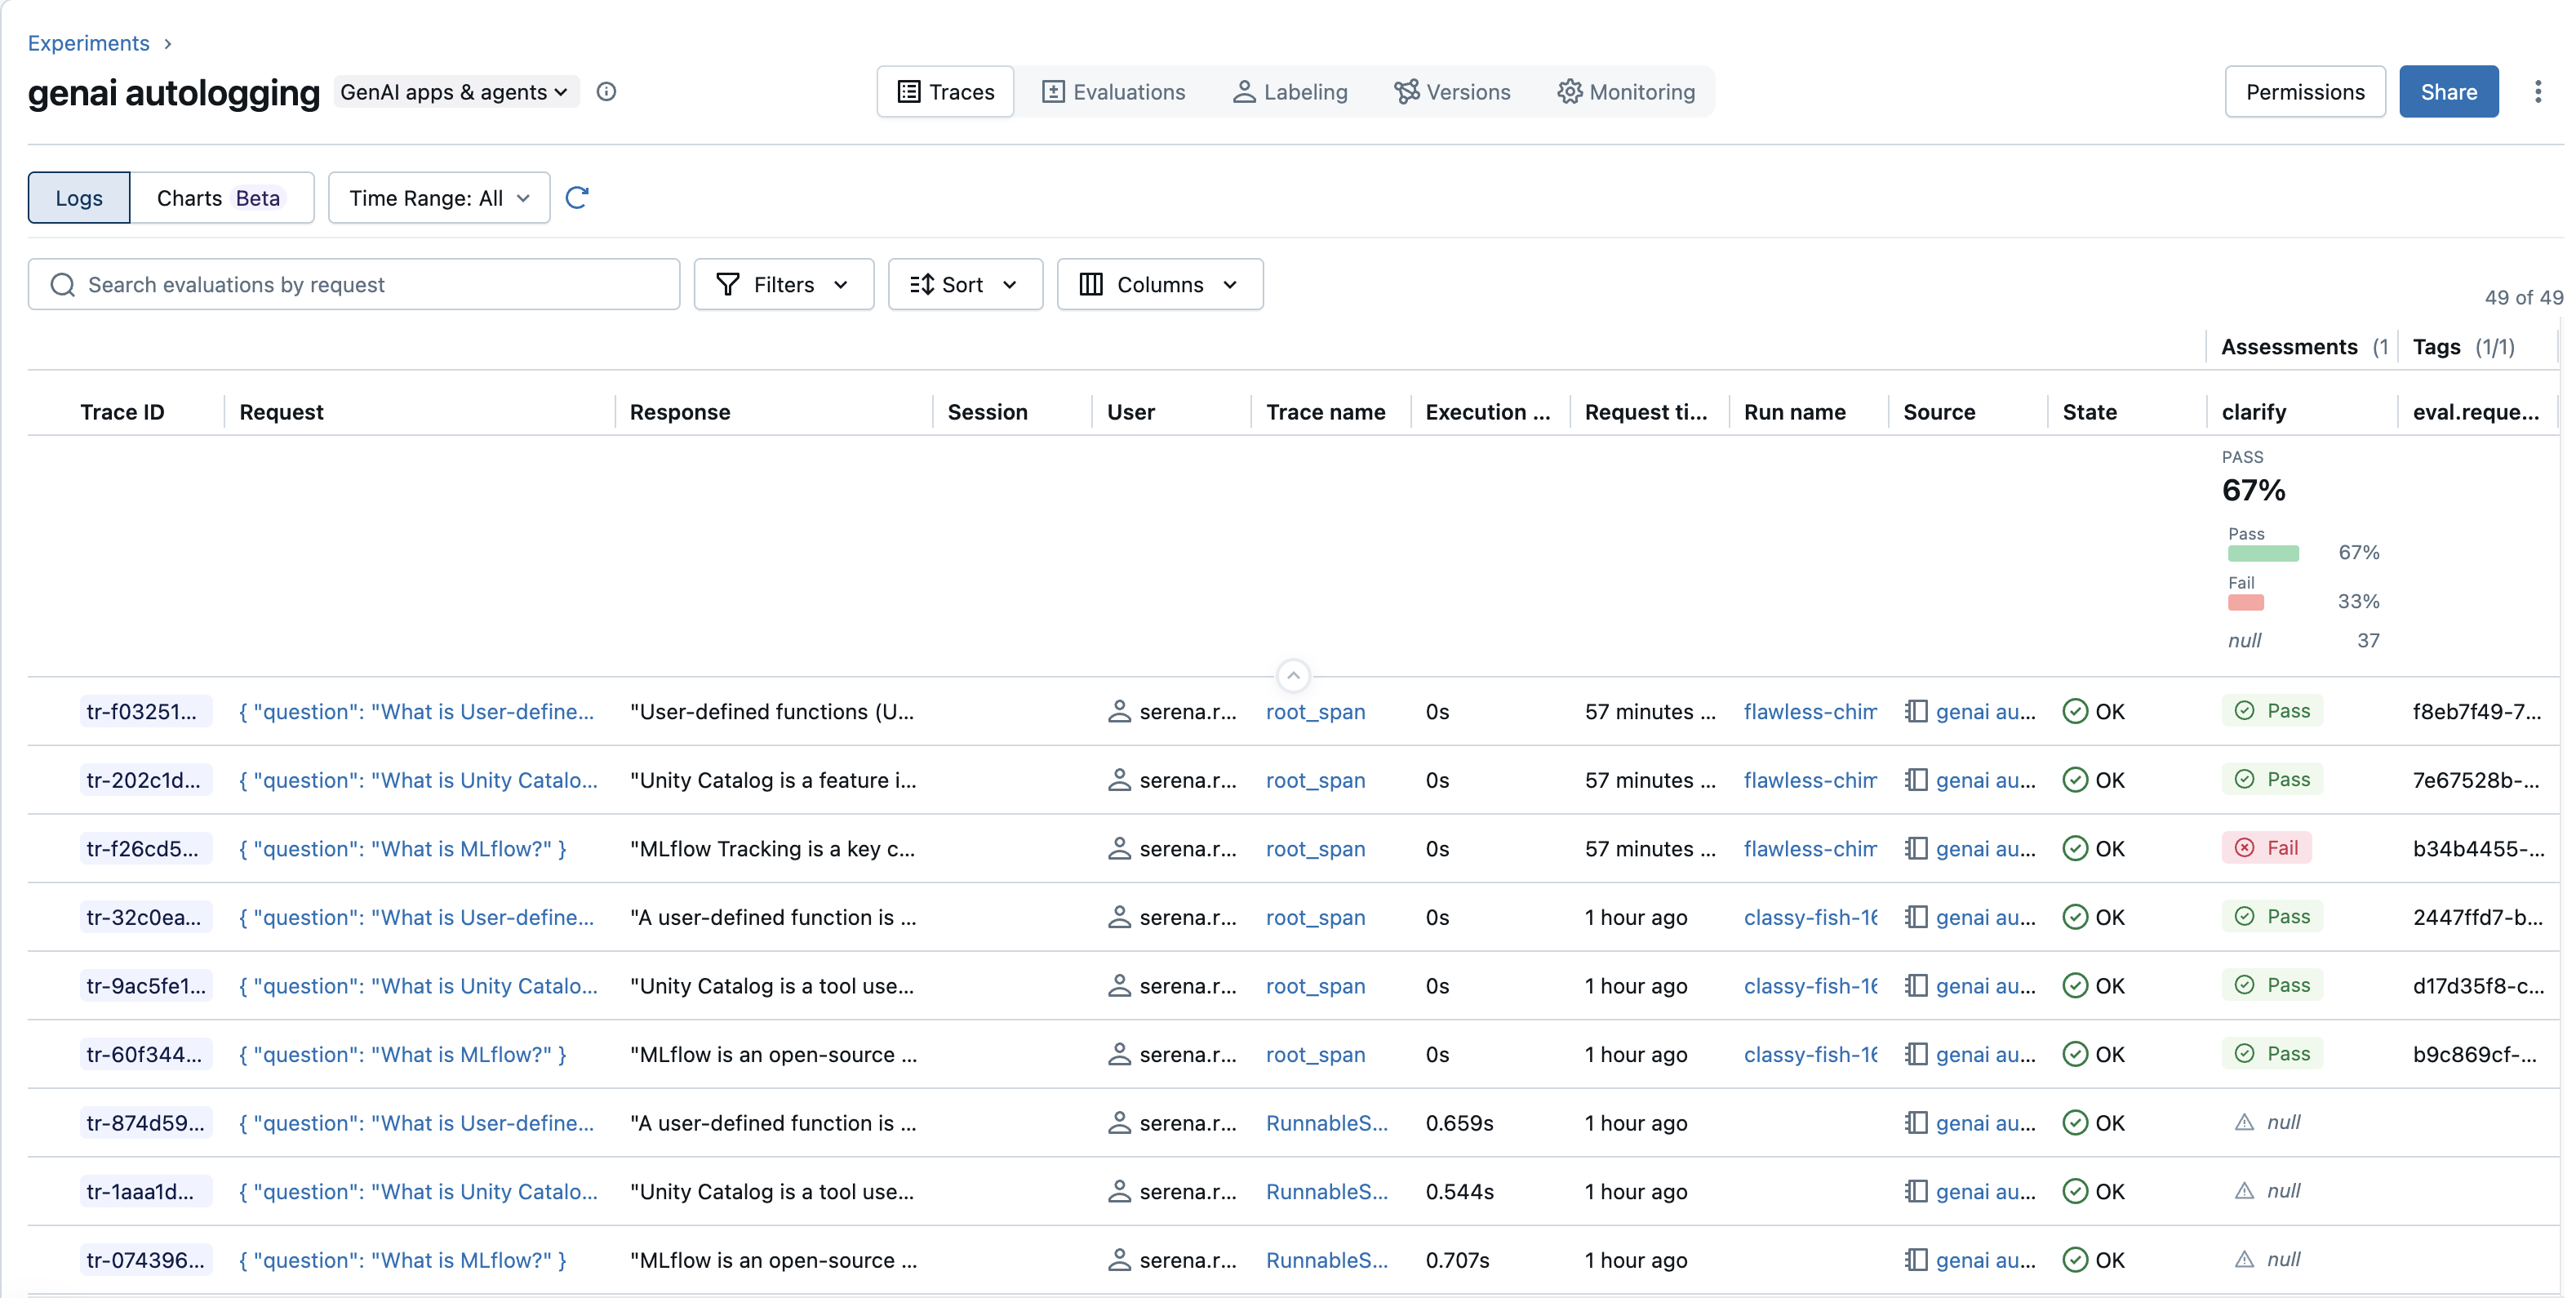
Once your agent is instrumented, its traces are where you see what happened and find where things went wrong. Start in the MLflow UI: open your experiment and click the Traces tab.
Here is a quick tour of what you can do from there:
- Ask in plain English. Click the sparkle (Filter with AI) in the Search box and describe the traces you want — for example, "Find traces that call the get_weather tool." MLflow turns your description into a filter over the trace list.
- Open a trace to inspect its details end to end: the span tree, and each step's inputs, outputs, timing, and errors.
- Analyze the trace. Click Analyze trace in the trace panel to have MLflow analyze the trace for issues.
- Add feedback. Click Assess and record a rating or note on the trace (or an expectation — the correct answer).
Next steps
- View traces in the Databricks MLflow UI — Everything the trace UI can do: search, filter, columns, and the trace detail view.
- Find issues across traces — Let MLflow detect issues across your traces.
- Collect feedback and build datasets — Collect feedback and build evaluation datasets.