Trace agents deployed on Databricks
This page shows how to deploy GenAI applications on Databricks so that production traces are captured automatically.
For apps deployed outside Databricks, see Trace agents deployed outside of Databricks.
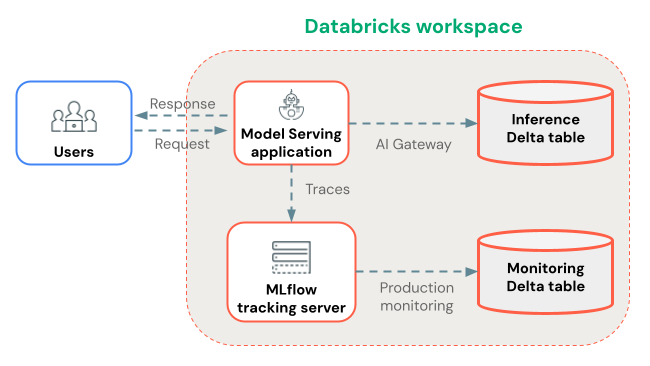
You can deploy GenAI applications on Databricks using Mosaic AI Agent Framework (recommended) or custom CPU Model Serving. Regardless of which deployment method you choose, traces are logged to your MLflow experiment for real-time viewing. You can optionally store traces long-term in Delta tables using Production Monitoring for durable storage and automated quality assessment.
Deploy with Agent Framework (recommended)
When you deploy GenAI applications using Mosaic AI Agent Framework, MLflow Tracing works automatically without additional configuration. Traces are stored in the agent's MLflow experiment.
Set up the storage location(s) for traces:
- If you plan to use Production Monitoring to store traces in Delta tables, then ensure it is enabled for your workspace.
- Create an MLflow Experiment for storing your app's production traces.
Next, in your Python notebook, instrument your agent with MLflow Tracing, and use Agent Framework to deploy your agent:
- Install the latest version of
mlflow[databricks]in your Python environment. - Connect to the MLflow Experiment using
mlflow.set_experiment(...). - Wrap your agent code using MLflow
ResponsesAgent. In your agent code, enable MLflow Tracing using automatic or manual instrumentation. - Log your agent as an MLflow model, and register it to Unity Catalog.
- Ensure that
mlflowis in the model's Python dependencies, with the same package version used in your notebook environment. - Use
agents.deploy(...)to deploy the Unity Catalog model (agent) to a Model Serving endpoint.
If you are deploying an agent from a notebook stored in a Databricks Git folder, MLflow 3 real-time tracing does not work by default.
To enable real-time tracing, set the experiment to a non-Git-associated experiment using mlflow.set_experiment() before running agents.deploy().
This notebook demonstrates the deployment steps above.
Agent Framework and MLflow Tracing notebook
Deploy with custom CPU serving (alternative)
If you can't use Agent Framework, deploy your agent using custom CPU Model Serving instead.
First, set up the storage location(s) for traces:
- If you plan to use Production Monitoring to store traces in Delta tables, then ensure it is enabled for your workspace.
- Create an MLflow Experiment for storing your app's production traces.
Next, in your Python notebook, instrument your agent with MLflow Tracing, and use the Model Serving UI or APIs to deploy your agent:
- Log your agent as an MLflow model with automatic or manual tracing instrumentation.
- Deploy the model to CPU serving.
- Provision a Service Principal or Personal Access Token (PAT) with
CAN_EDITaccess to the MLflow experiment. - In the CPU serving endpoint page, go to "Edit endpoint." For each deployed model to trace, add the following environment variables:
ENABLE_MLFLOW_TRACING=trueMLFLOW_EXPERIMENT_ID=<ID of the experiment you created>- If you provisioned a Service Principal, set
DATABRICKS_CLIENT_IDandDATABRICKS_CLIENT_SECRET. If you provisioned a PAT, setDATABRICKS_HOSTandDATABRICKS_TOKEN.
Trace storage
Databricks logs traces to the MLflow experiment that you set with mlflow.set_experiment(...) during deployment. Traces are available for real-time viewing in the MLflow UI.
Traces are stored as artifacts, for which you can specify a custom storage location. For example, if you create a workspace experiment with artifact_location set to a Unity Catalog volume, then trace data access is governed by Unity Catalog volume privileges.
Store traces long-term with Production Monitoring
After traces are logged to your MLflow experiment, you can optionally store them long-term in Delta tables using Production Monitoring (in beta).
Benefits of Production Monitoring for trace storage:
- Durable storage: Store traces in Delta tables for long-term retention beyond the MLflow experiment artifact lifecycle.
- No trace size limits: Unlike alternative storage methods, Production Monitoring handles traces of any size.
- Automated quality assessment: Run MLflow scorers on production traces to continuously monitor application quality.
- Fast sync: Traces sync to Delta tables approximately every 15 minutes.
Alternatively, you can use AI Gateway-enabled inference tables to store traces. However, be aware of the limitations on trace sizes and sync delays.
Next steps
- View traces in the Databricks MLflow UI - View traces in the MLflow UI.
- Production monitoring - Store traces in Delta tables for long-term retention and automatically evaluate with scorers.
- Add context to traces - Attach metadata for request tracking, user sessions, and environment data.