Set OpenTelemetry span attributes for MLflow
When you send traces from a custom OpenTelemetry-instrumented (OTel) application to Databricks MLflow, you must set specific span attributes to correctly render your trace data in the MLflow UI. This page shows you which OpenTelemetry GenAI Semantic Convention attributes to set.
If you use a pre-built integration such as Langfuse, that integration sets these attributes automatically. This page is for applications with custom OTel instrumentation.
The attributes in Databricks managed MLflow differ from OSS (open source software) MLflow. For the OSS MLflow attribute mapping, see the MLflow documentation.
Requirements
Before you begin, make sure you have:
- A Databricks workspace with the OTel tracing preview enabled
- The OTLP exporter configured to send traces to your workspace. See Log traces to the Unity Catalog tables.
- An application instrumented with the OpenTelemetry SDK
Set span type
Each span in your trace needs a type label so MLflow can identify what kind of operation it represents. Set gen_ai.operation.name to one of the values in the following table by calling span.set_attribute("gen_ai.operation.name", "<value>"). MLflow reads this attribute and displays the corresponding MLflow span type in the trace UI.
OTel | MLflow span type |
|---|---|
|
|
|
|
|
|
|
|
|
|
|
|
|
|
|
|
span.set_attribute("gen_ai.operation.name", "chat")
Set inputs and outputs
Set gen_ai.input.messages and gen_ai.output.messages on each span that should display inputs and outputs. Setting them on the root span also populates the trace-level request and response previews.
OTel attribute | MLflow attribute |
|---|---|
|
|
|
|
Values can be plain strings or JSON-serialized strings. Using JSON arrays of message objects with role and content fields enables richer rendering in the MLflow UI (for example, labeled "User" and "Assistant" bubbles):
import json

# Plain string — displays as-is in the UI
span.set_attribute("gen_ai.input.messages", "What is the weather today?")

# JSON message array — renders with role labels in the UI
span.set_attribute("gen_ai.input.messages", json.dumps([
    {"role": "system", "content": "You are a helpful assistant."},
    {"role": "user", "content": "What is the weather today?"}
]))
span.set_attribute("gen_ai.output.messages", json.dumps([
    {"role": "assistant", "content": "It is sunny and 72°F in San Francisco."}
]))
Set token usage
To display token counts in the UI trace summary, set gen_ai.usage.input_tokens and gen_ai.usage.output_tokens by calling span.set_attribute() on the root span. MLflow reads these values from the root span specifically because it aggregates counts at the trace level.
OTel | MLflow token field |
|---|---|
| Input token count |
| Output token count |
(not set — calculated automatically) | Total token count |
root.set_attribute("gen_ai.usage.input_tokens", 150)
root.set_attribute("gen_ai.usage.output_tokens", 42)
Set session and user
To associate traces with a specific session or user, set session.id and user.id on any span by calling span.set_attribute(). MLflow reads these attributes from the root span and displays them as trace-level metadata. Setting session.id enables the session tab in the MLflow UI.
OTel attribute | MLflow metadata field |
|---|---|
| Session or conversation identifier |
| Application end-user identifier |
span.set_attribute("session.id", "conversation-123")
span.set_attribute("user.id", "user-456")
Full example: instrument a Python agent
The following example puts all four attribute categories together in a simple agent with an LLM child span. It assumes you have already configured the OTLP exporter to send traces to Databricks.
import json
from opentelemetry import trace

tracer = trace.get_tracer("my-agent")

def run_agent(query: str) -> str:
    with tracer.start_as_current_span("agent-run") as root:
        # Child LLM span — set gen_ai attributes for this individual call
        with tracer.start_as_current_span("chat") as llm:
            llm.set_attribute("gen_ai.operation.name", "chat")
            messages = [
                {"role": "system", "content": "You are a helpful assistant."},
                {"role": "user", "content": query}
            ]
            response = call_llm(messages)
            llm.set_attribute("gen_ai.input.messages", json.dumps(messages))
            llm.set_attribute("gen_ai.output.messages", json.dumps([
                {"role": "assistant", "content": response}
            ]))
            llm.set_attribute("gen_ai.usage.input_tokens", 150)
            llm.set_attribute("gen_ai.usage.output_tokens", 42)

        # Root span — MLflow reads inputs, outputs, token usage, and session ID
        # from the root span to populate the trace summary in the UI.
        root.set_attribute("gen_ai.operation.name", "chat")
        root.set_attribute("session.id", "conversation-123")
        root.set_attribute("user.id", "user-456")
        root.set_attribute("gen_ai.input.messages", json.dumps([
            {"role": "user", "content": query}
        ]))
        root.set_attribute("gen_ai.output.messages", json.dumps([
            {"role": "assistant", "content": response}
        ]))
        root.set_attribute("gen_ai.usage.input_tokens", 150)
        root.set_attribute("gen_ai.usage.output_tokens", 42)
        return response
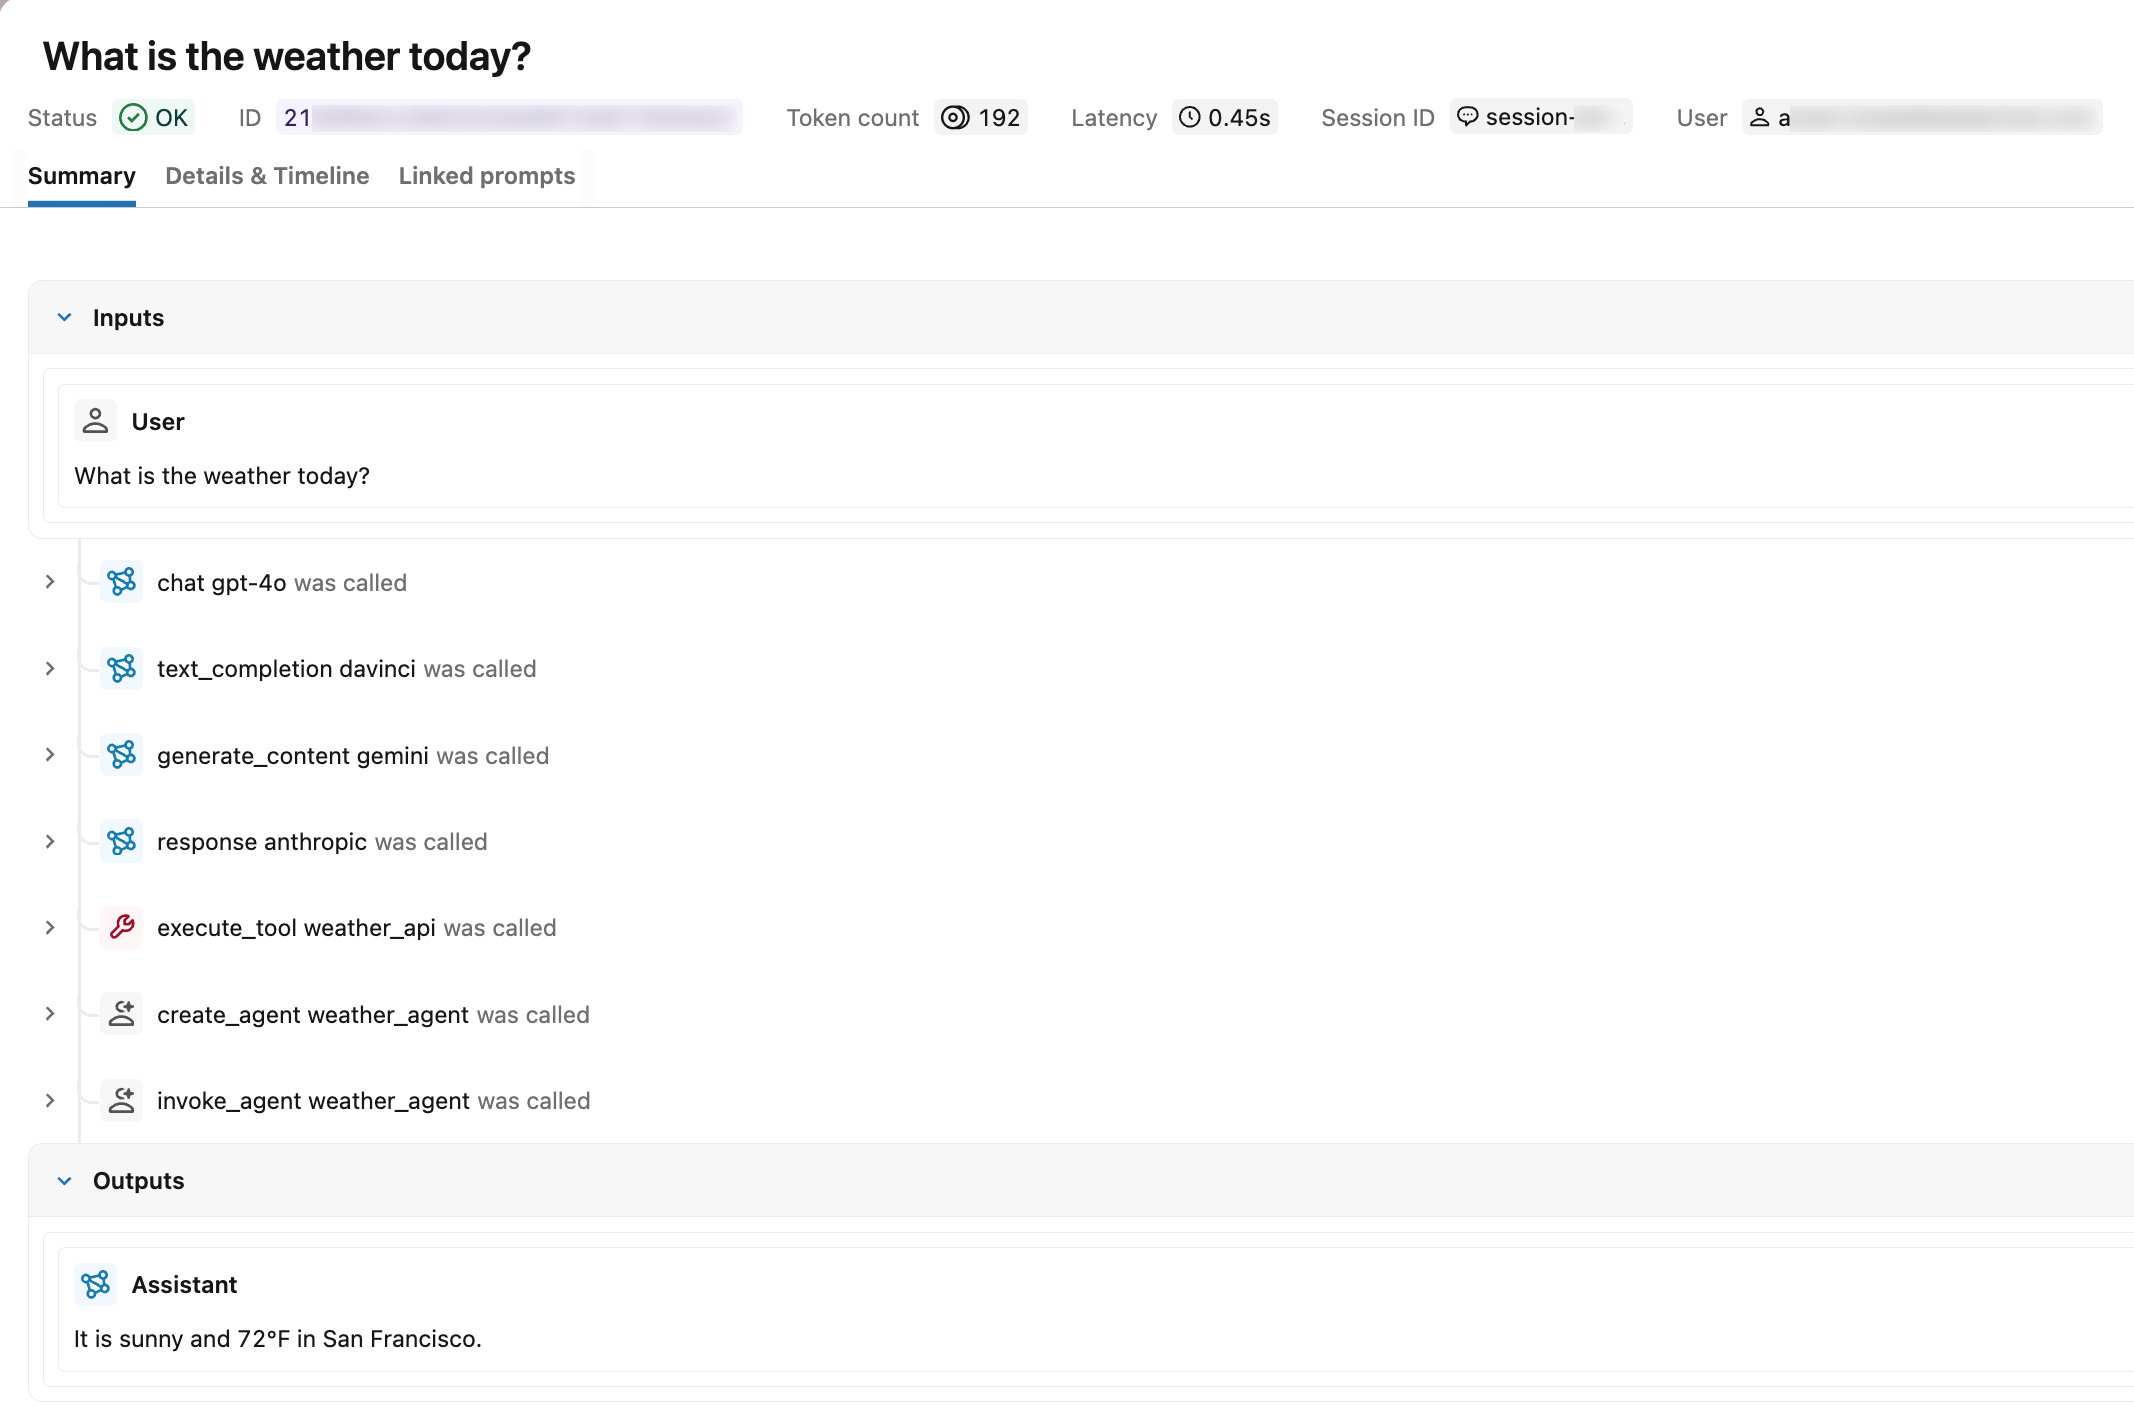
Verify in the MLflow UI
After you call run_agent(), open the MLflow Traces tab in your experiment. A correctly instrumented trace shows:
- Span types: Each span displays its type label (for example,
chat) instead ofUNKNOWN - Request and response: The root span shows the input messages and output messages
- Token usage: The trace summary displays input, output, and total token counts
- Session and user: The trace appears in the session tab under the specified session identifier, and the user ID is visible in the trace metadata
Search for traces by OTel span attributes
After ingesting OTel traces into Unity Catalog, use the span.attributes.* prefix in mlflow.search_traces() to filter by the OTel attribute values you set. The attribute name after the prefix is the same OTel attribute name you set with span.set_attribute().
import mlflow

# experiment_id is visible in the MLflow UI URL and experiment details panel
mlflow.set_experiment(experiment_id="<experiment-id>")

# Find traces from a specific session (set using session.id)
traces = mlflow.search_traces(
    filter_string="span.attributes.session.id = 'conversation-123'"
)

# Find traces from a specific user (set using user.id)
traces = mlflow.search_traces(
    filter_string="span.attributes.user.id = 'user-456'"
)

# Find traces from a specific model (set using gen_ai.request.model)
traces = mlflow.search_traces(
    filter_string="span.attributes.gen_ai.request.model LIKE '%gpt%'"
)

# Find traces by operation type (set using gen_ai.operation.name)
traces = mlflow.search_traces(
    filter_string="span.attributes.gen_ai.operation.name = 'chat'"
)

# Find high-token traces (set using gen_ai.usage.input_tokens)
traces = mlflow.search_traces(
    filter_string="span.attributes.gen_ai.usage.input_tokens > 1000"
)
For the full filter_string syntax including supported operators and comparators, see Search traces programmatically.
Limitations
Custom OTel span attributes are not surfaced as MLflow trace tags. Attributes you set with span.set_attribute() outside the recognized OTel-to-MLflow mappings on this page do not appear in:
- The Tags column or the unified trace view in the MLflow UI
- The
_traces_unifiedUnity Catalog table - The
tagsfield returned bymlflow.search_traces()
These attributes are preserved on the underlying span. They remain visible in the Attributes tab of the MLflow trace UI and are queryable through the <prefix>_otel_spans.attributes field of the OTel spans table.
To attach searchable tags that appear in the unified trace view, use the MLflow tag APIs instead. See Attach custom tags and metadata.
Additional resources
- Search traces programmatically - Search and filter traces programmatically using the MLflow SDK.
- Query OpenTelemetry traces stored in Unity Catalog - Query trace data at scale using Databricks SQL.