Tracing overview
Using a coding agent? Paste this prompt:
Read the documentation at https://docs.databricks.com/aws/en/mlflow3/genai/tracing/overview and set up MLflow tracing for my agent.
Optionally, install mlflow/skills for a deeper integration with MLflow.
MLflow Tracing is the observability foundation for GenAI development on Databricks. AI agents run complex, multi-step workflows that combine components such as LLMs, retrievers, tools, and sub-agents. Tracing records the inputs, outputs, latency, token usage, and cost of every intermediate step, mapping the full execution flow so you can see exactly how your agent behaves and identify causes for issues. Tracing is the foundational data layer for agent quality. Debugging, evaluation, and production monitoring all build on the evidence your traces capture.
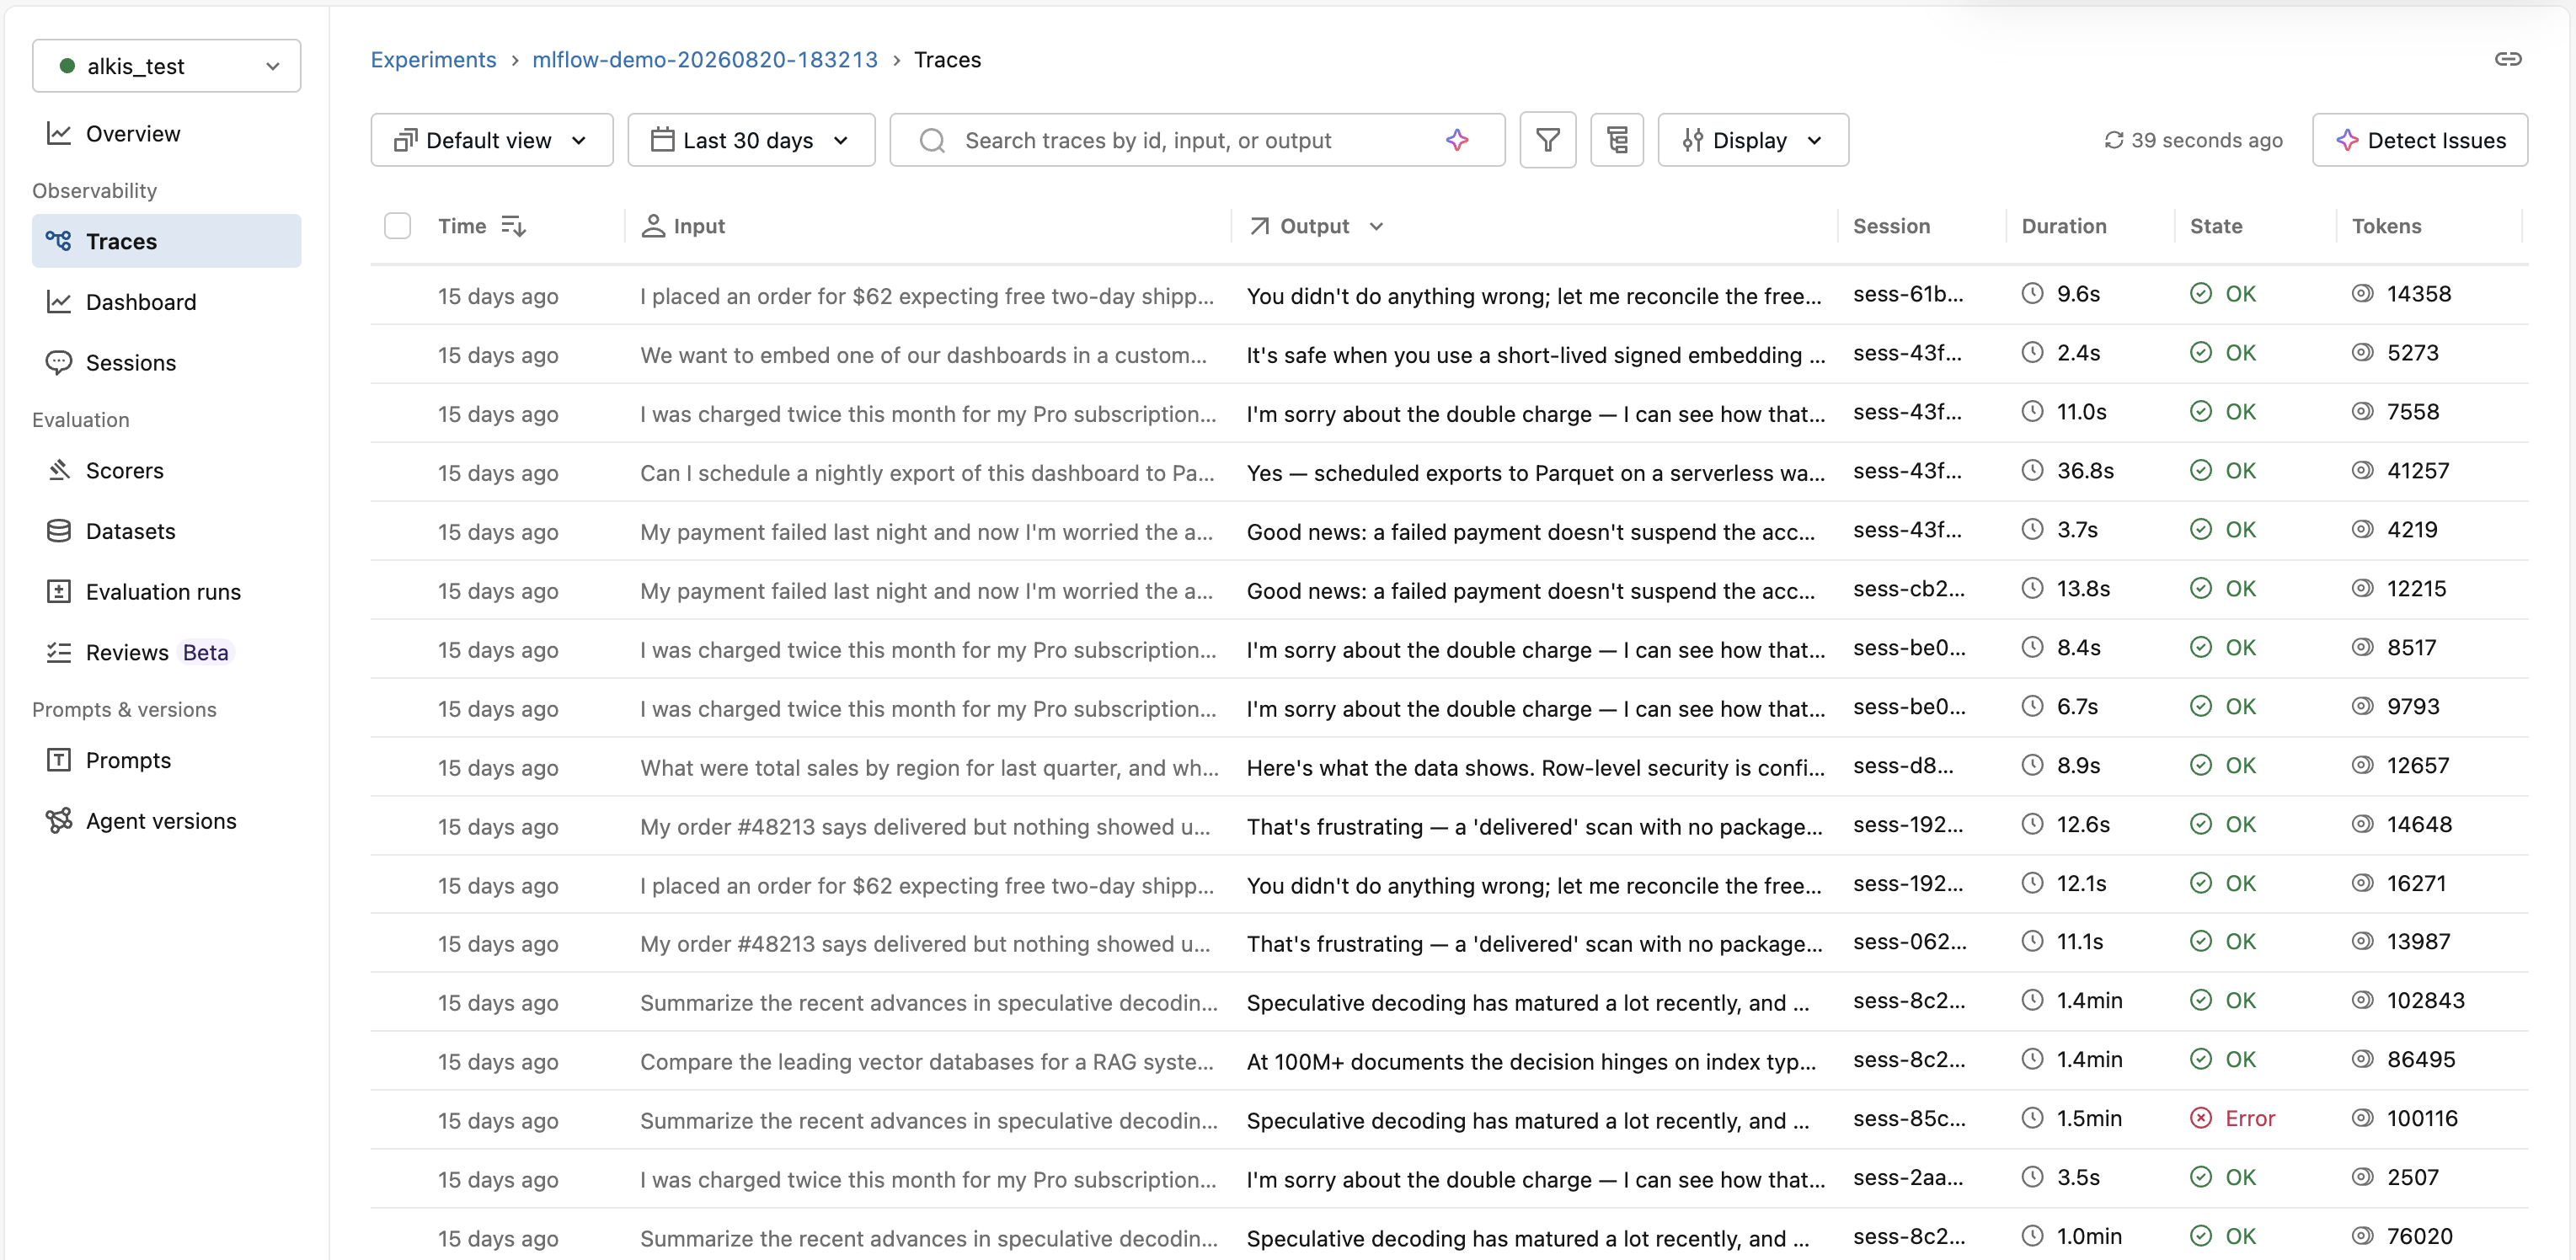
Tracing lets you:
- Debug and understand your agent.
- Monitor performance and optimize cost.
- Monitor production agents.
- Evaluate and improve agent quality.
- Use natural language with Genie Code to analyze, debug, and explore trace data.
Why MLflow Tracing on Databricks
- The same open-source MLflow, fully managed. You use the standard MLflow SDK and OpenTelemetry — with no tracking server to run and no version to maintain yourself.
- Unity Catalog-native storage and governance. Store traces as Unity Catalog Delta tables with schema- and table-level access control, no per-experiment limit, and direct SQL access. See Store OpenTelemetry traces in Unity Catalog.
- Natural-language analysis with Genie Code. Ask questions of your trace data and explore failures without writing SQL.
- One platform from development to production. The same traces power debugging, evaluation, and production monitoring, and plug into the rest of the Lakehouse — AI/BI dashboards, alerts, and Lakeflow pipelines.
Get your first trace
Install MLflow and the libraries for the example agent:
%pip install --upgrade "mlflow[databricks]>=3.1.0" "langgraph" "langchain-openai"
dbutils.library.restartPython()
Set an OPENAI_API_KEY so the agent can call a model (or point the agent at Databricks Foundation Model APIs to avoid an external key):
import os

os.environ["OPENAI_API_KEY"] = "your-api-key"
Run this agent. Autologging captures a trace with a span for each step:
import mlflow
from langchain_core.tools import tool
from langchain_openai import ChatOpenAI
from langgraph.prebuilt import create_react_agent

mlflow.langchain.autolog()  # LangGraph uses LangChain's autolog
mlflow.set_tracking_uri("databricks")
mlflow.set_experiment("/Shared/my-first-trace")

@tool
def get_weather(city: str):
    """Get weather for a city."""
    return f"It might be cloudy in {city}"

agent = create_react_agent(ChatOpenAI(model="gpt-4o-mini"), [get_weather])
agent.invoke({"messages": [("user", "What is the weather in SF?")]})
# Trace appears in the MLflow UI automatically
To view the trace:
- In your workspace, go to Experiments.
- Find the experiment — here, the one set by
mlflow.set_experiment("/Shared/my-first-trace"). - Click the Traces tab to see the trace.
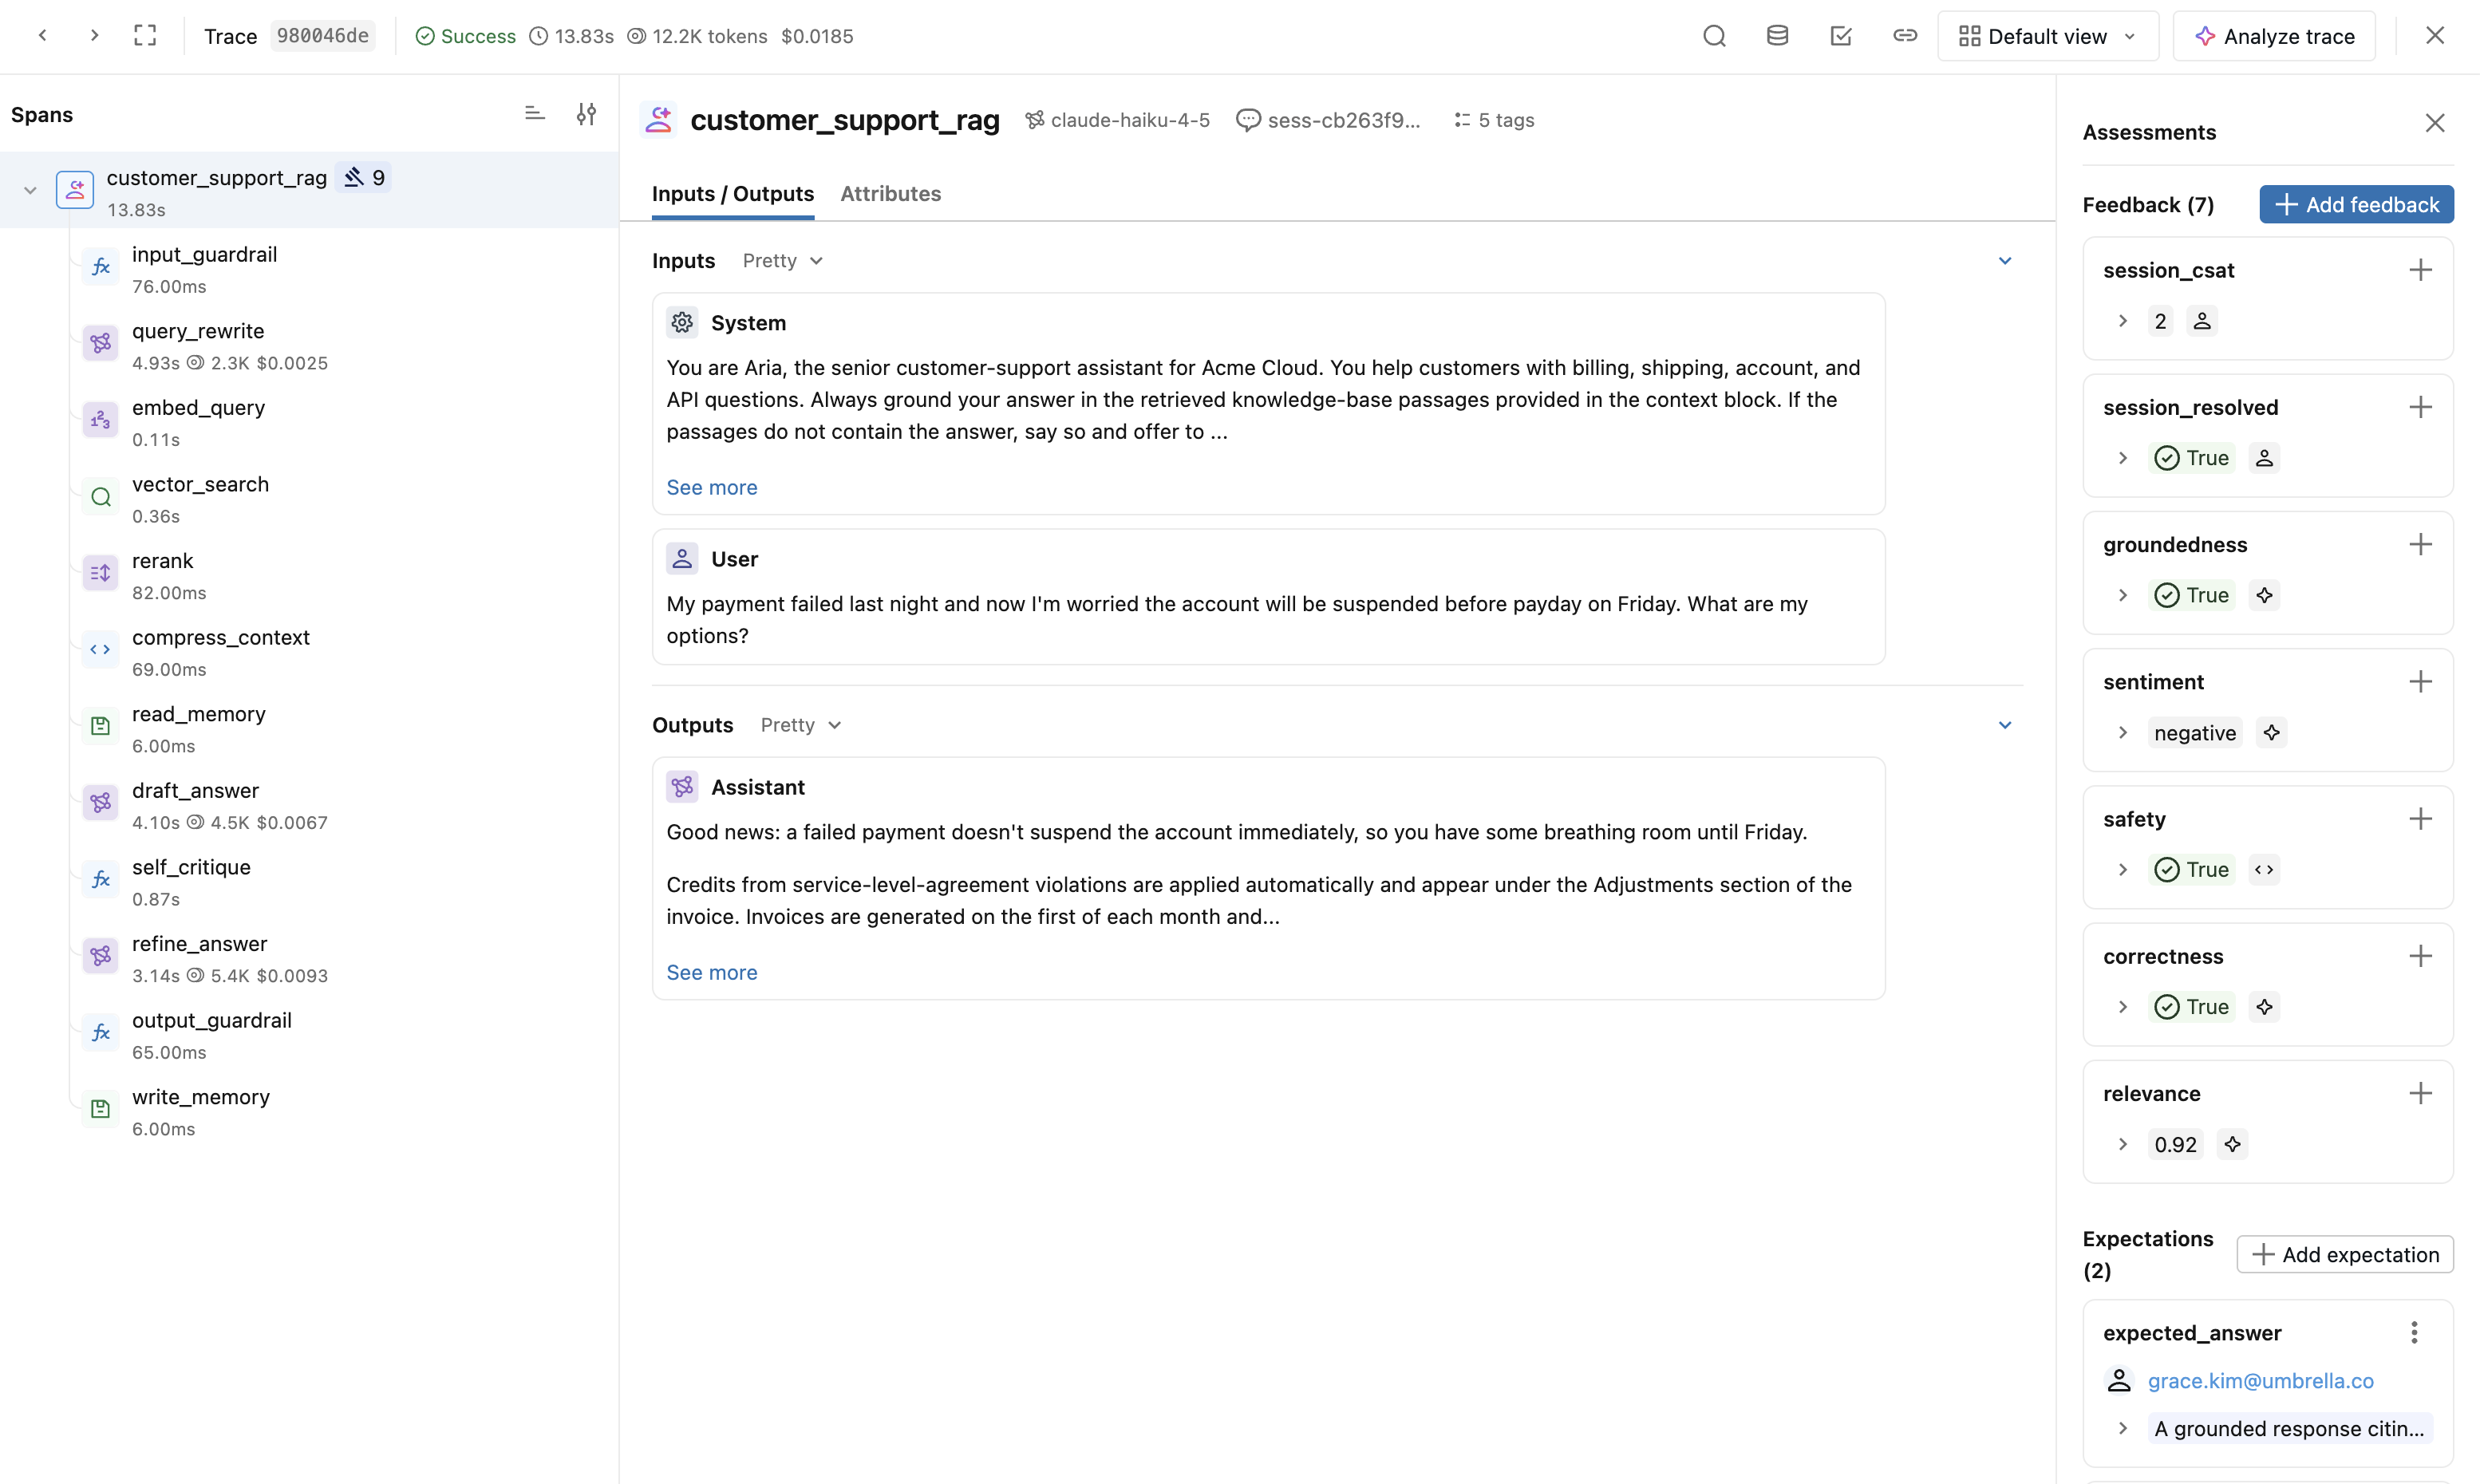
- Open the trace to see the full span tree (agent → LLM call → tool call).
Next steps
- Automatic tracing and integrations — Trace 30+ frameworks with one line.
- Manual and custom tracing — Add custom spans when autolog doesn't cover your code.
- Observe and find issues — Explore your traces, find issues, and query trace data.