Use the observability dashboards
This feature is in Beta. Workspace admins can control access to this feature from the Previews page. See Manage Databricks previews.
When you configure observability for a project, Lakebase creates ready-made Lakeview dashboards over your telemetry tables, so you get rich, interactive charts of your Postgres activity without building any yourself. They read the same Delta tables in Unity Catalog that Insights and Genie use.
On the project's Monitoring page, the Metrics tab gives live graphs of a single compute (CPU, memory, connections, cache hit rate) for a zero-setup answer to "is my database healthy right now?" The Advanced Postgres Telemetry tab is always present too, but stays empty until you configure observability. Once telemetry is flowing, it holds a card linking to each of these dashboards. Because they run over the telemetry captured to Delta tables, they persist across restarts and answer the questions Metrics can't: which query is slow, whether a plan changed, and what differs between two time intervals.
Prerequisites
- A Lakebase project with observability configured and a running compute.
- The dashboards are created the first time the configuration writes telemetry, so give it a few minutes after you first set observability up. Like the tables, they don't appear until telemetry has flowed at least once.
Open a dashboard
Open a project's dashboards from the Advanced Postgres Telemetry tab:
- Open your project and go to Monitoring.
- Select the Advanced Postgres Telemetry tab. It lists a card for each dashboard the project's observability configuration creates.
- Click a card to open that dashboard in Databricks SQL, in a new tab. The dashboard opens filtered to the branch's primary (read/write) endpoint.
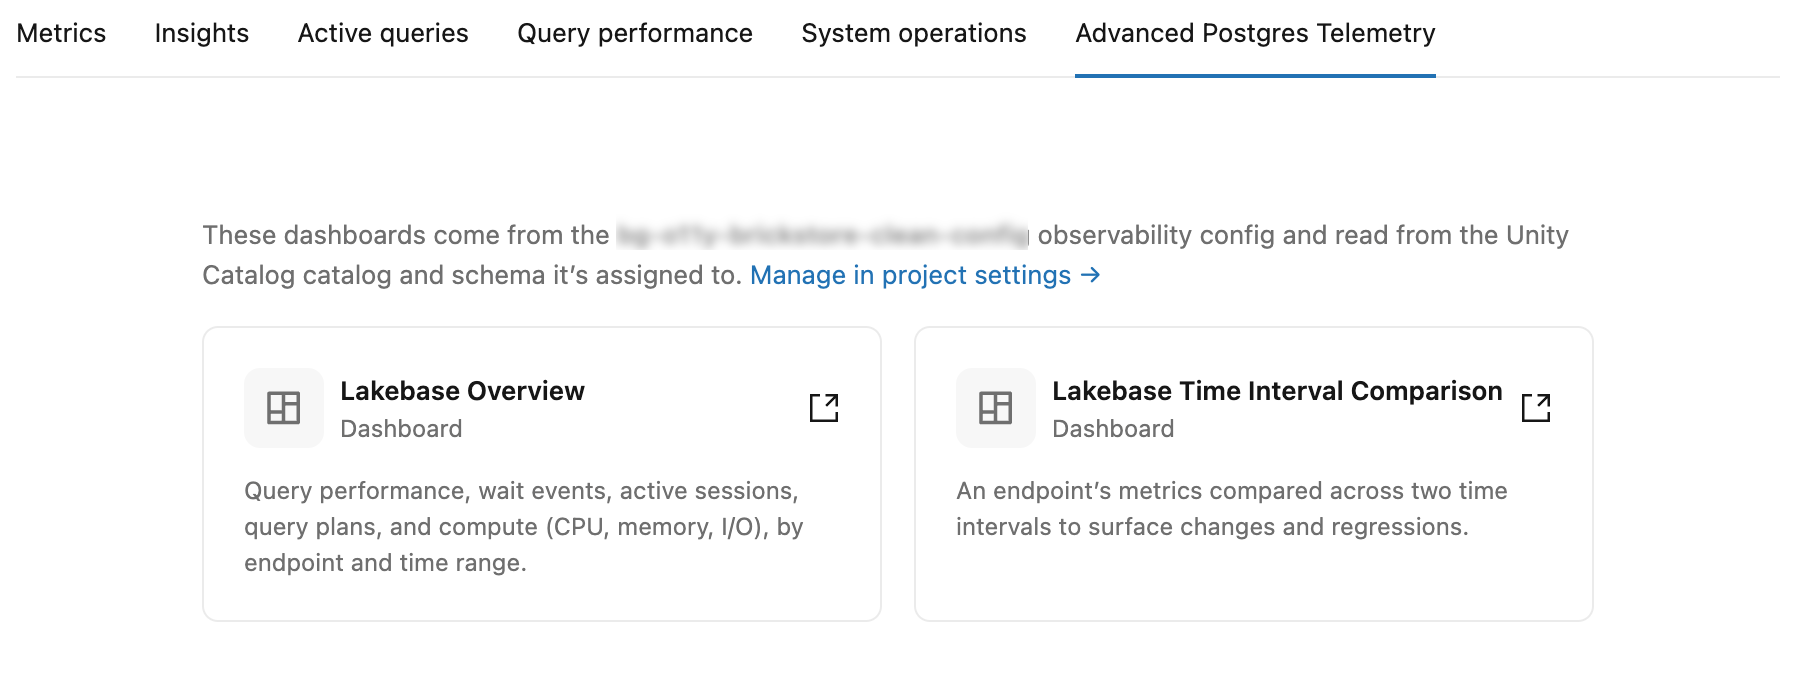
If the tab shows an empty state instead of cards, one of two things is missing:
- No configuration assigned — the project has no advanced telemetry configured yet. Assign or create an observability configuration in the project's settings first. See Configure observability.
- No dashboards yet — a configuration is assigned but hasn't created its dashboards yet. They appear once the configuration provisions them, shortly after telemetry first flows.
You can also open the dashboards directly. In the workspace, go to Dashboards and search for Lakebase Overview or Lakebase Time Interval Comparison. Because the dashboards are ordinary Lakeview dashboards in your workspace (see The dashboards are yours), they're searchable there like any other.
The default dashboards
Two dashboards are created for every observability configuration. Each dashboard has filters that scope its views, so you can narrow to the time window and compute you care about. The exact filters and where they live differ between the two dashboards, as described below.
Lakebase Overview
A broad view of a project's health and performance over a time range, for one or more endpoints. It has three pages.
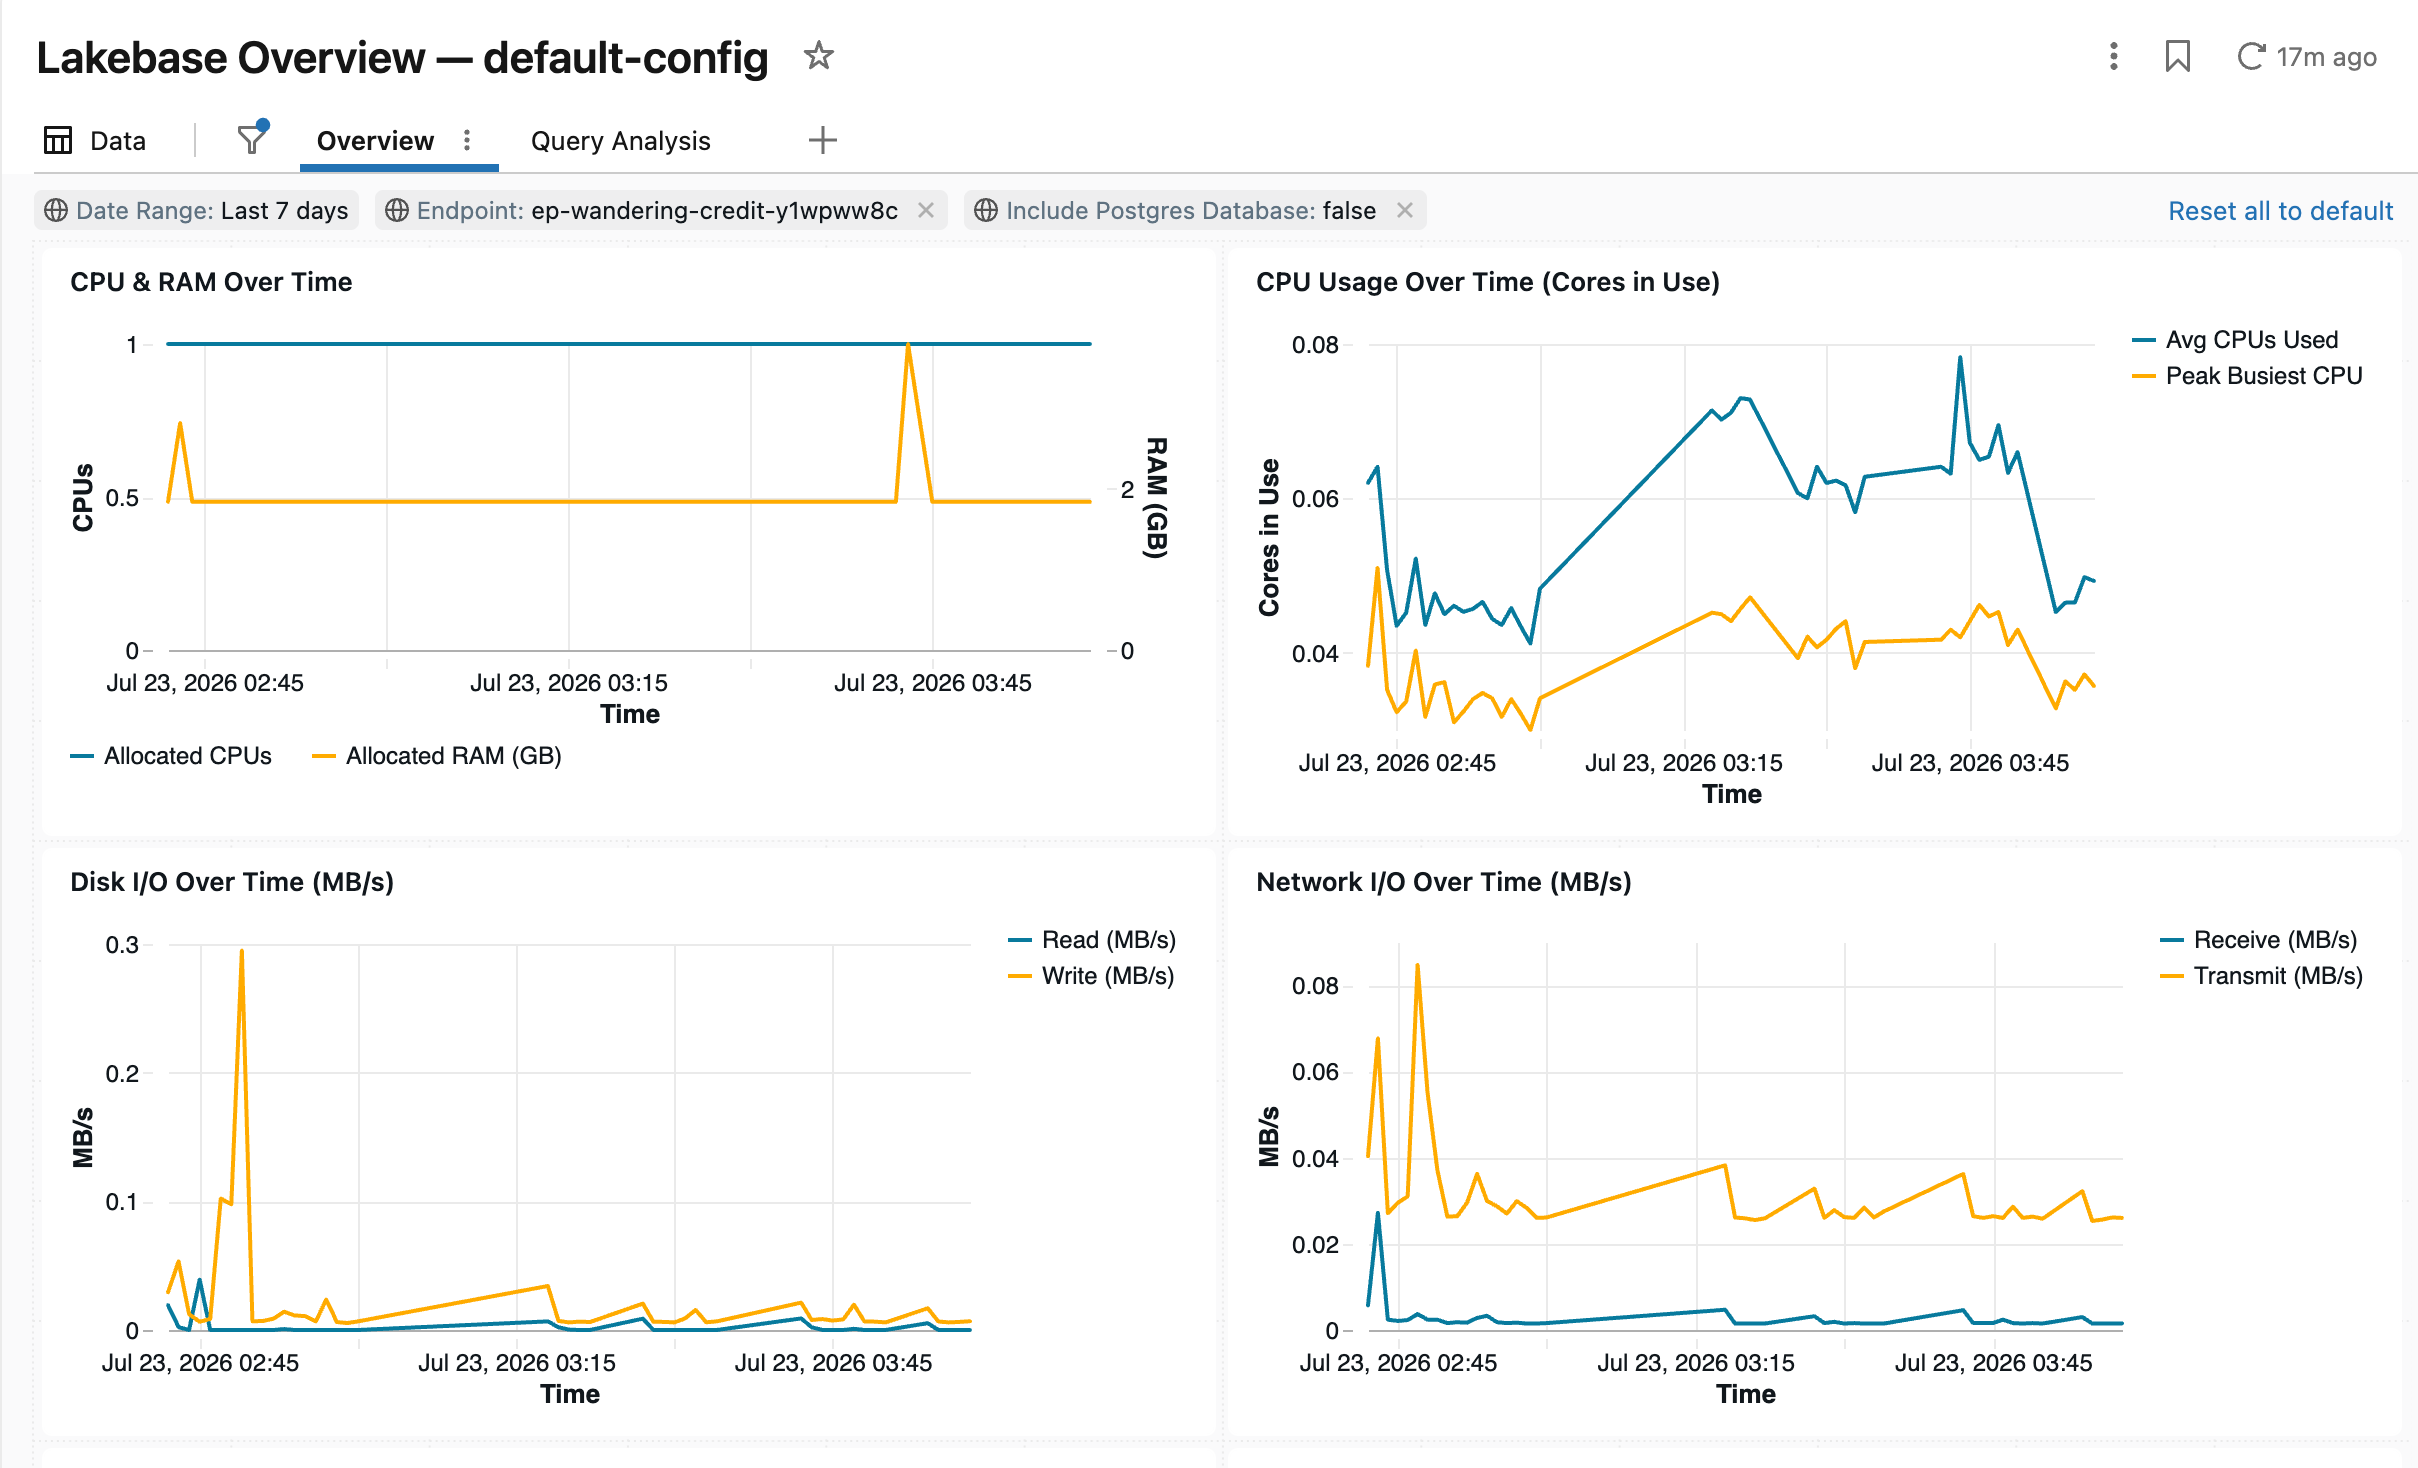
The Overview page covers compute, connections, queries, and waits at a glance:
Graph | What it shows | Reads from |
|---|---|---|
CPU & RAM Over Time | Compute CPU and memory usage across the selected window. |
|
CPU Usage Over Time (Cores in Use) | Cores in use over time. Sustained periods near your allocated CPU indicate the compute is CPU-bound. |
|
Disk I/O Over Time (MB/s) | Disk read/write throughput over time. |
|
Network I/O Over Time (MB/s) | Network throughput over time. |
|
Connections per Endpoint | Connection count over time, broken out by endpoint. |
|
Active Sessions Over Time | Concurrent active sessions over time. |
|
Query Execution Volume Over Time | How many queries ran over time. |
|
Avg Query Execution Time (ms) | Average query latency over time. |
|
Top 20 Queries by Call Count | The most frequently executed queries in the window. |
|
Top 10 Queries: Total Exec Time Over Time | The queries consuming the most total execution time, tracked over the window. |
|
Top 10 Queries: % Change Avg Exec Time (vs Mean) | Queries whose average latency deviates most from their own mean, to surface regressions. |
|
Wait Time by Class Over Time | Time spent waiting, broken out by wait class (locks, I/O, and others), over time. Which class dominates points to where queries are blocked. |
|
Top 25 Slowest Queries (Plan History) | The slowest individual executions captured in plan history. |
|
LFC Memory Overview by Endpoint | Local file cache memory use by endpoint, an indicator of working-set size. |
|
The Query Analysis page drills into a single query (selected with the page's Query ID filter):
Graph | What it shows | Reads from |
|---|---|---|
Query Calls & Avg Exec Time Over Time | Call volume and average latency for the selected query over time. |
|
Execution Time per Plan Hash | Execution time by plan hash, so you can see when a query's plan changed and how each plan performs. A sudden slowdown often appears here as a new, slower plan hash. |
|
Query Duration Stats | Duration statistics for the selected query's executions. |
|
Avg I/O Stats Over Time | Average I/O the selected query performed over time. |
|
Top 5 Longest Executions | The five slowest individual executions of the selected query. |
|
The Global Filters page holds the controls that scope every other page: Date Range, Endpoint, and Include Postgres Database.
Lakebase Time Interval Comparison
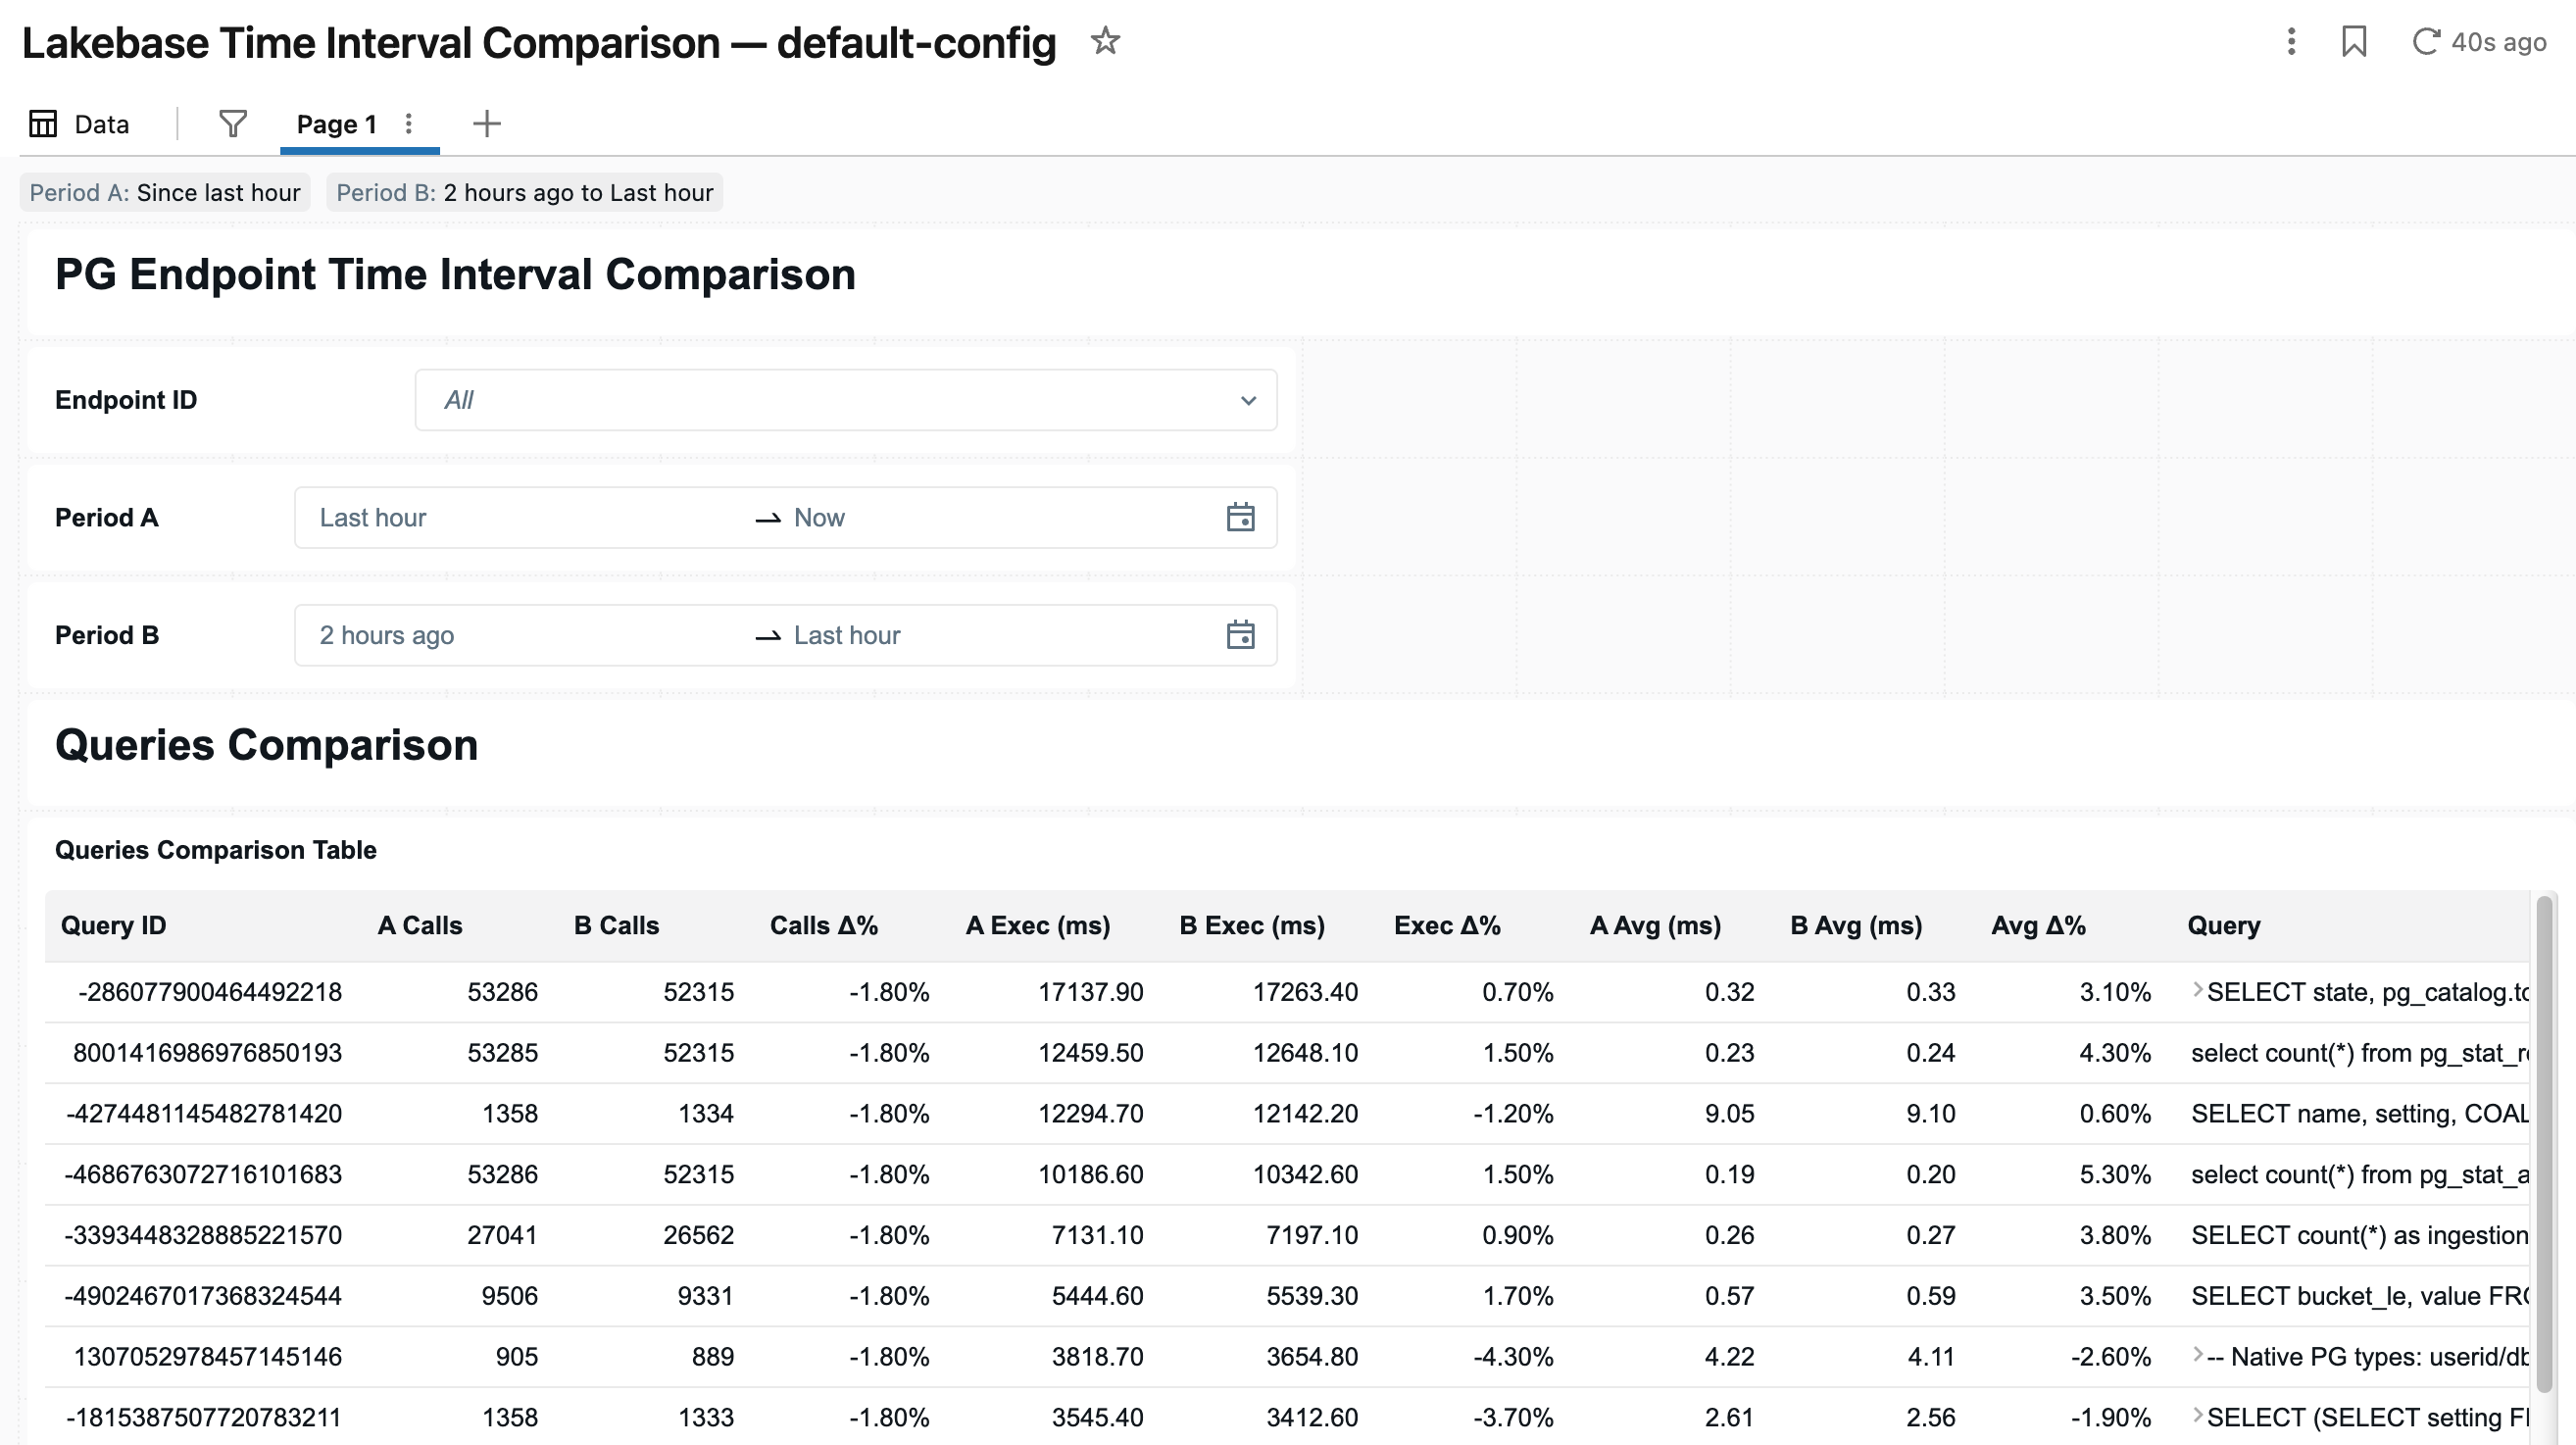
Compares an endpoint's activity across two time intervals you pick (a "before" and "after") to surface changes and regressions, for example after a deploy or a traffic spike. You set Period A and Period B with the date-range pickers and choose the endpoint, then read the two periods side by side:
Graph | What it shows | Reads from |
|---|---|---|
Top Wait Events — Period A / Period B | The dominant wait events in each period, as side-by-side bars. |
|
Wait Events Over Time — Period A / Period B | How wait events trend within each period. |
|
Wait Events Comparison Table | Wait events for the two periods in one table, so shifts stand out. |
|
Queries Comparison Table | Query statistics for the two periods side by side, to spot which queries got slower or busier. |
|
For what every column in these tables means, see Telemetry table reference.
Share a dashboard
The dashboards are created as drafts that you own, so you can open and use them right away.
If you want to share a dashboard with other users, publish it. When you publish, you choose how its queries run for those viewers:
- Embedded credentials — queries run as the publisher, and you manage access at the dashboard level. This is the simpler option.
- Viewer credentials — queries run as each viewer, so you grant them permissions on the underlying telemetry tables. This is more work, but it lets others run their own custom queries against the same data.
Customize and extend a dashboard
The dashboards are yours to change. Because each is an ordinary Lakeview dashboard, you can edit it like any other: retitle or remove graphs, change visualizations, adjust the default filters, or add your own graphs and pages backed by the same telemetry tables (or joined with any other data in Unity Catalog). For how to edit Lakeview dashboards, see Dashboards.
If you'd rather keep the originals untouched, clone a dashboard first and customize the copy.
To build entirely new views, write your own queries against the telemetry tables with any Databricks SQL tool. The data is standard Delta in your own Unity Catalog.
The dashboards are yours
The dashboards and the telemetry tables are user-owned. Lakebase creates them, but they belong to you, and removing the configuration never removes them:
- Deleting the observability configuration doesn't delete them. If you delete or reassign a configuration, its dashboards and telemetry tables stay in place. Any edits you made to a dashboard are preserved. Remove them yourself if you no longer want them.
- Changing where a configuration writes (its catalog, schema, or table prefix) leaves the existing dashboards alone and creates a fresh dashboard pointed at the new destination. The earlier dashboard remains as your standalone content.
Because they're standard Lakeview dashboards and Delta tables in your own Unity Catalog, they behave like any other content you own, rather than being locked inside a separate observability product.
Next steps
- Capture telemetry to the Lakehouse — set up the observability configuration that creates these dashboards.
- Telemetry table reference — every table and column the graphs read from.
- Find and resolve issues with Insights — let a background agent surface issues from the same telemetry.
- Diagnose and fix issues with Genie — investigate a problem conversationally.