Quickstart: Lakebase observability
This feature is in Beta. Workspace admins can control access to this feature from the Previews page. See Manage Databricks previews.
Turn on telemetry for a single project using your own credentials, then view it in a dashboard, get your first Insight, and ask Genie a question. To set up shared credentials or cover multiple projects, see Configure observability.
Before you start
- The Lakebase Advanced Postgres Telemetry preview enabled for your workspace. A workspace admin turns it on from the Previews page.
- An existing Lakebase project.
Turn on an observability configuration
Open the project's Settings > Observability config > Create new config. Name it, choose Use user-level credentials as the identity (the fastest path for testing on your own), then select a Unity Catalog catalog and schema to receive telemetry (the schema must already exist, and the catalog can't use Default storage). Turn on Enable insights, assign the configuration to this one project, and save.
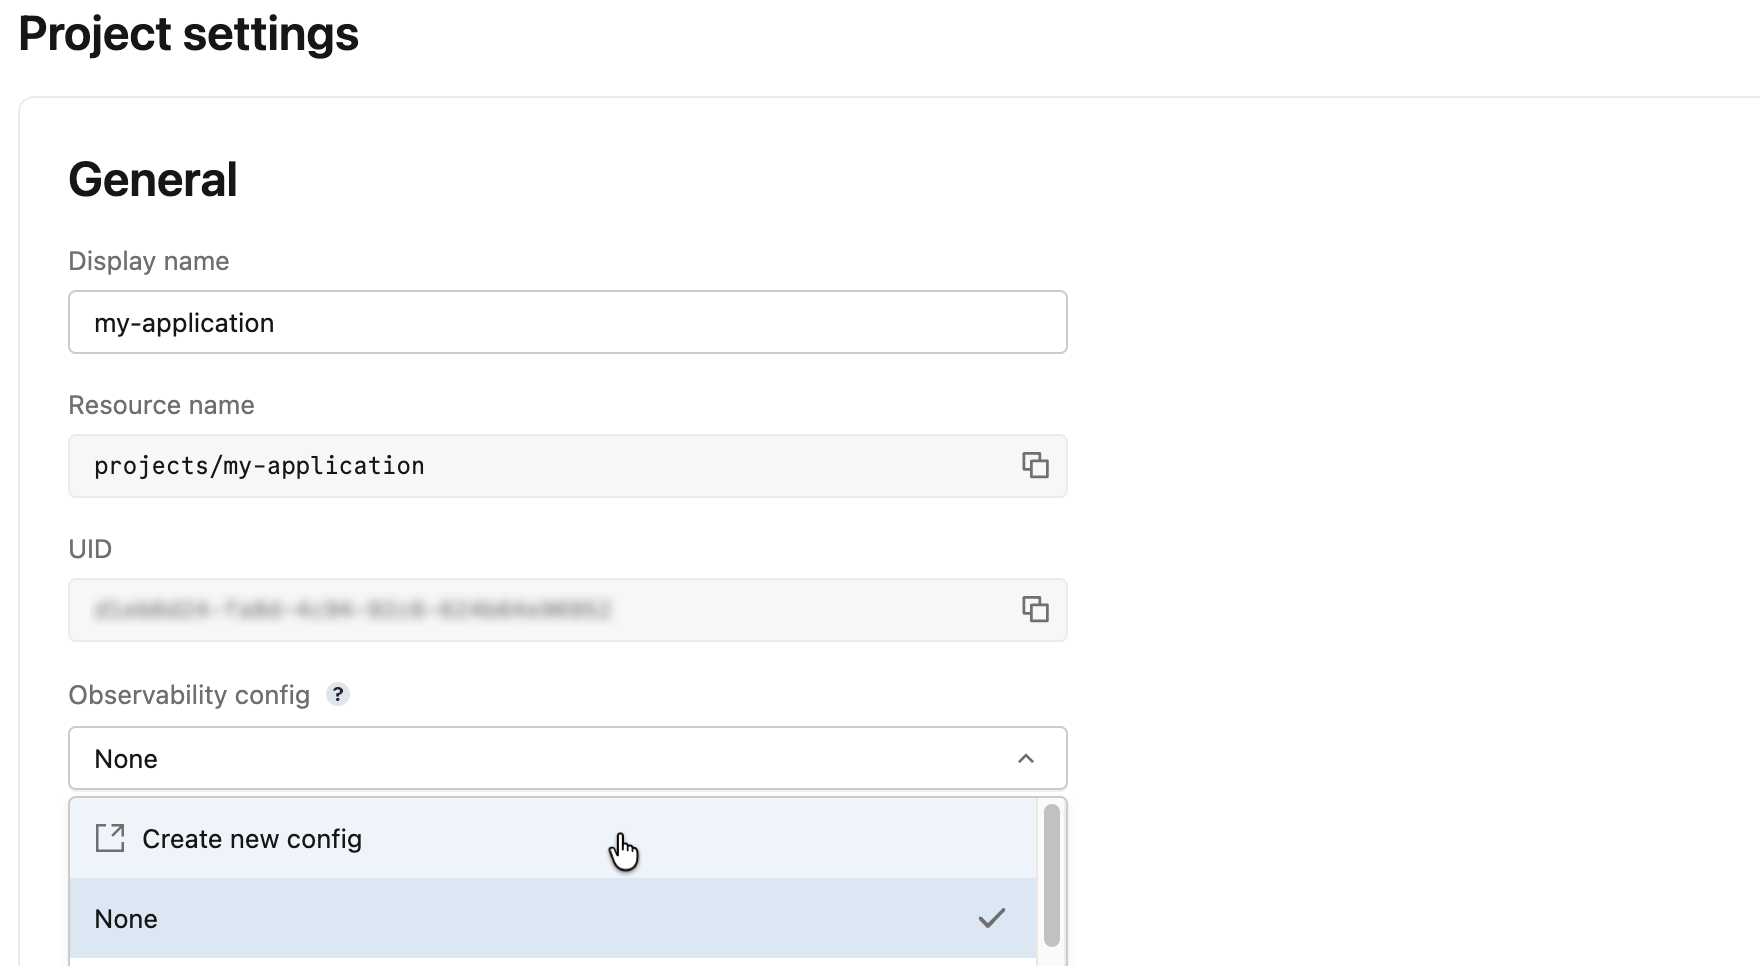
Setting this up for shared credentials or multiple projects? See Configure observability.
View your telemetry in a dashboard
Once telemetry starts flowing (give it a few minutes, and restart the compute if it was already running), Lakebase creates ready-made dashboards over it. Open the project's Monitoring page and select the Advanced Postgres Telemetry tab, then click the Lakebase Overview card to open the dashboard.
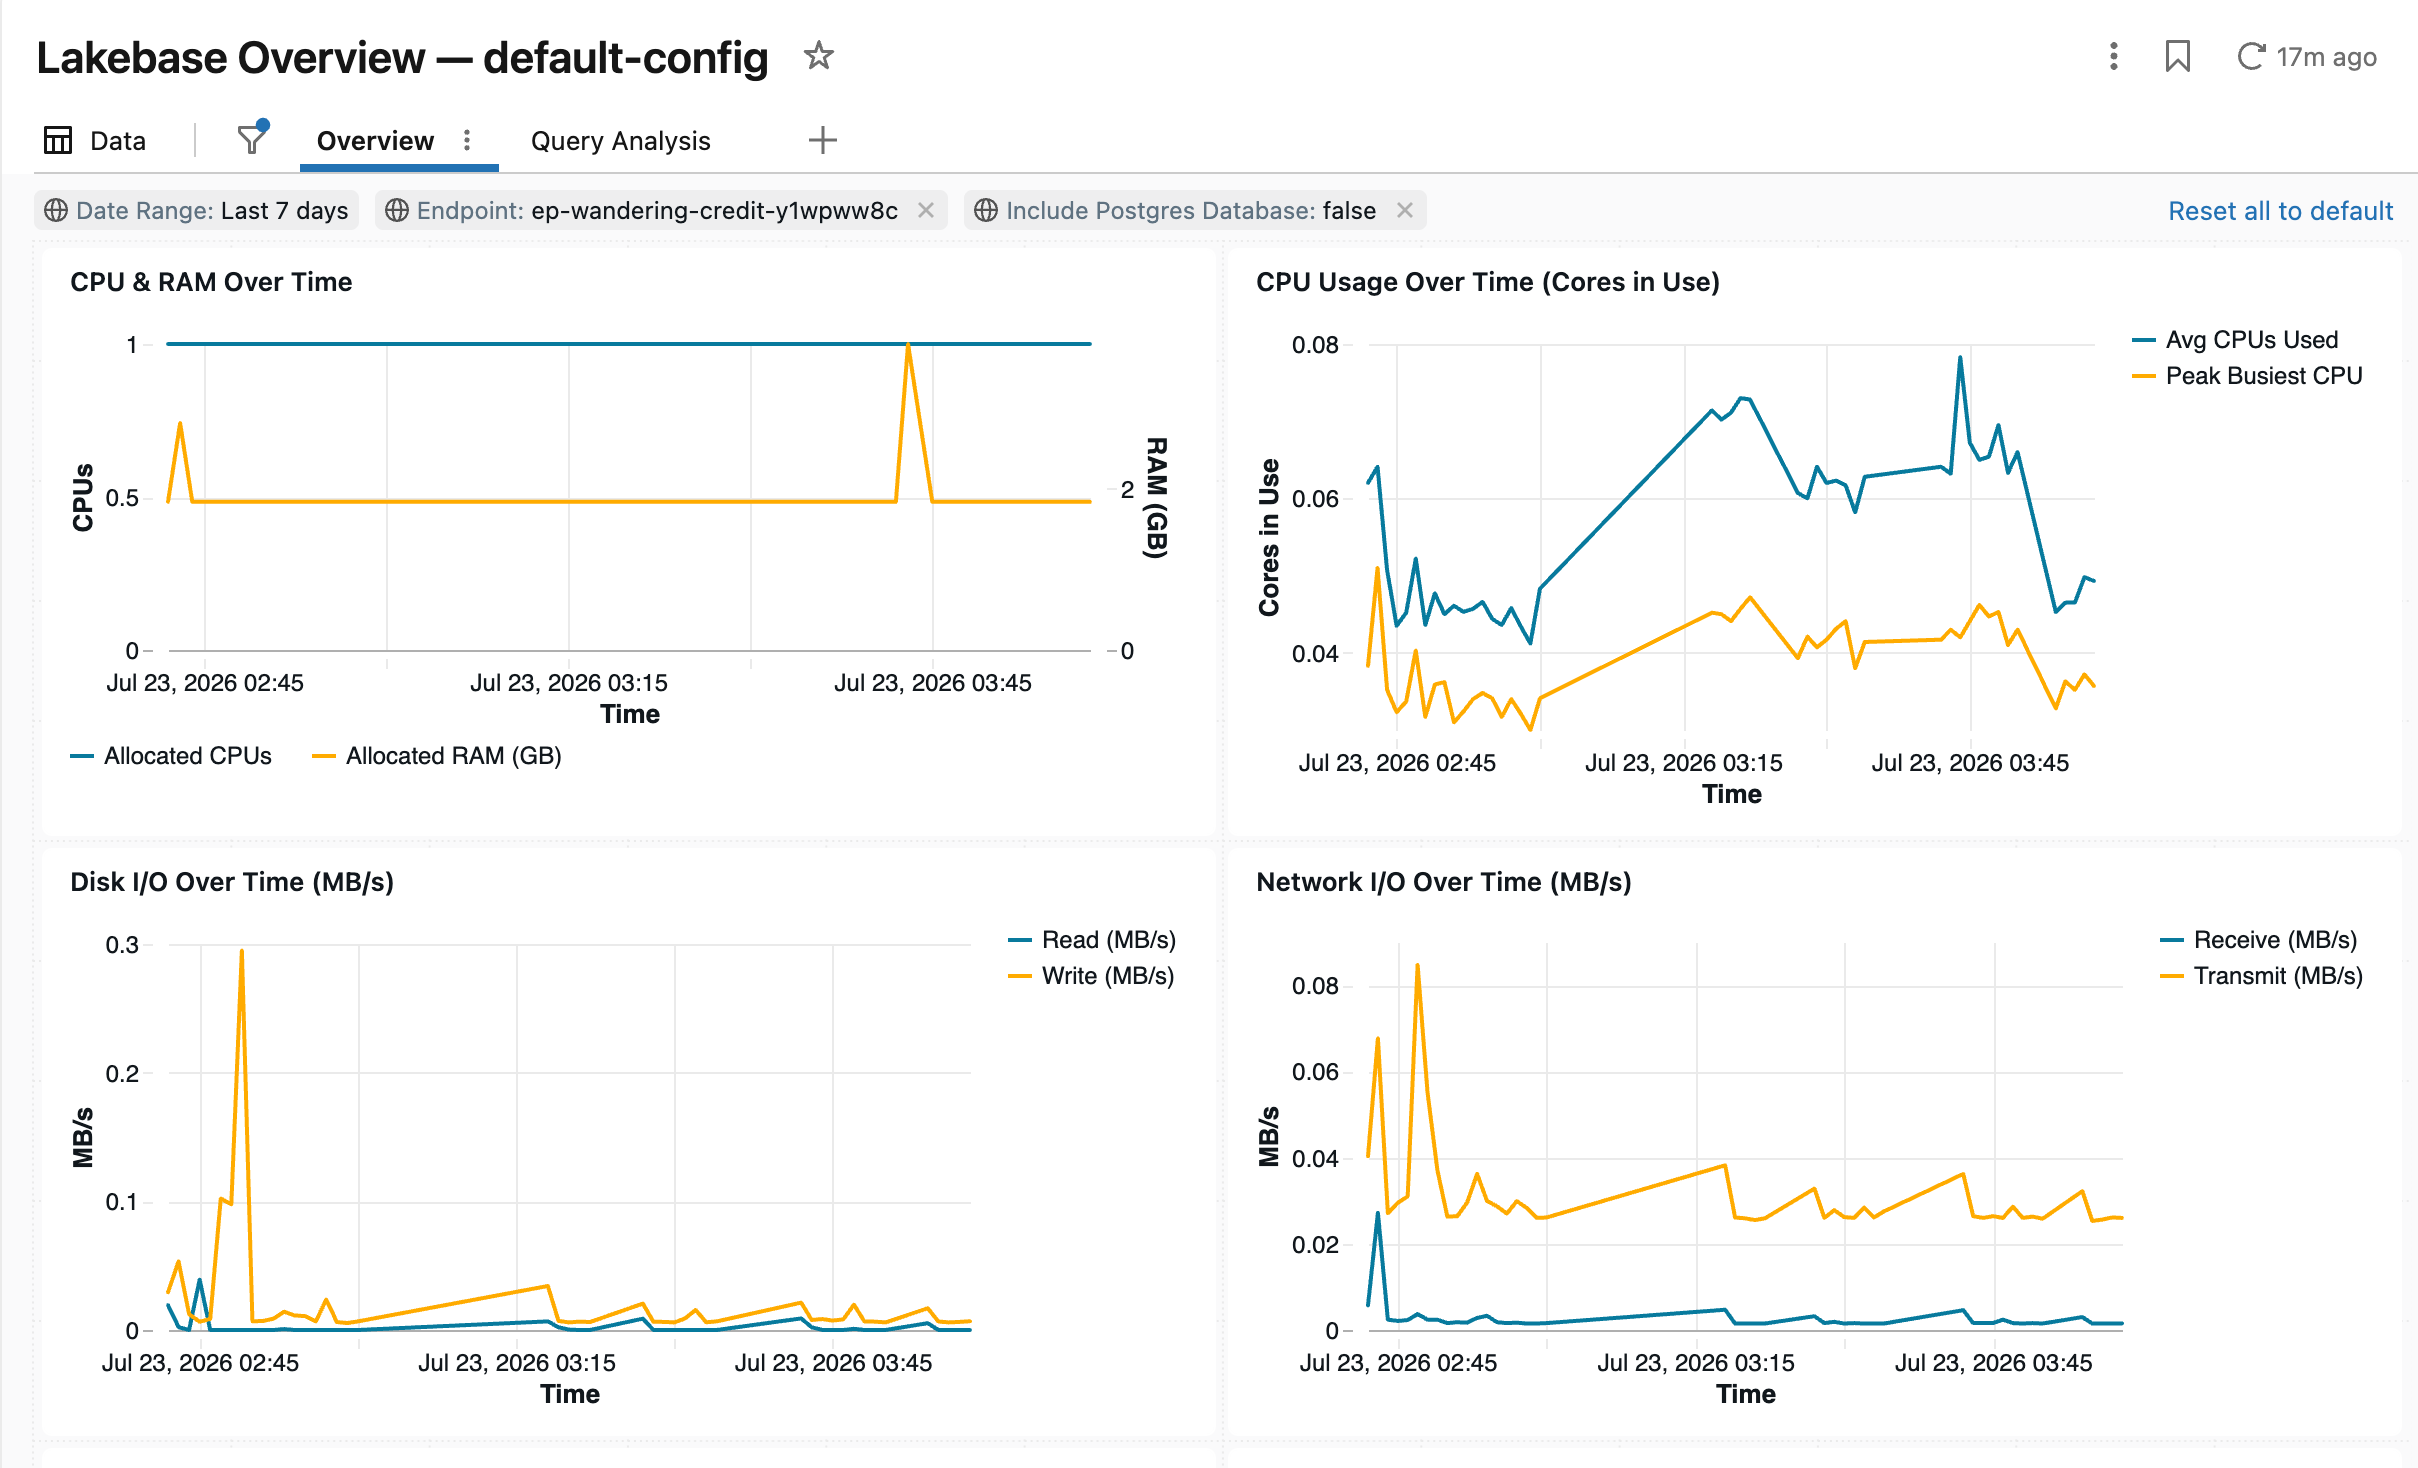
This is the same telemetry Insights and Genie evaluate, shown visually. For everything the dashboards cover, see Use the observability dashboards.
Wait for your first Insight
Insights evaluates your telemetry on a schedule. Once the project has some activity, open Monitoring > Insights on it and wait for the first entry to appear: a severity, a plain-language summary, supporting evidence, and a recommendation.
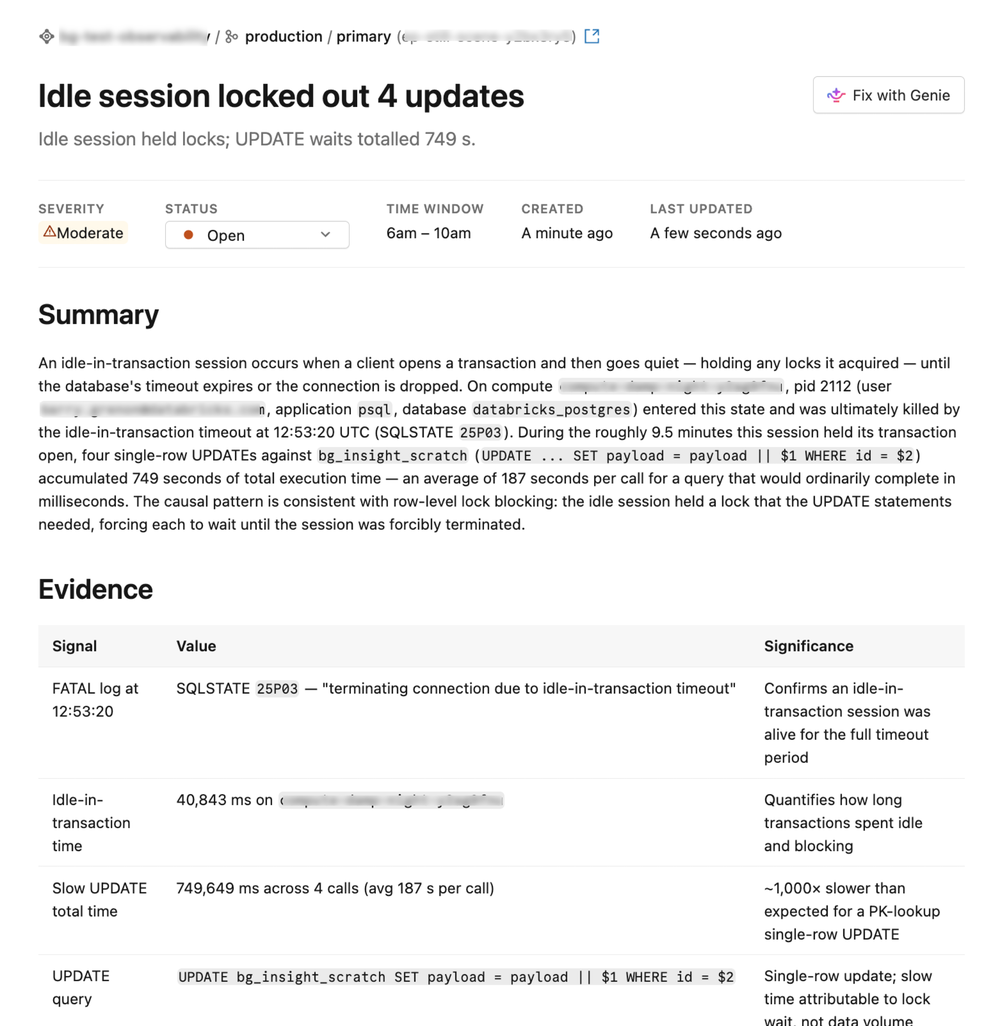
Ask Genie a question
Open Genie on the project and describe what you're seeing, in your own words. Because it reads the telemetry you just captured, questions about query performance and waits get grounded answers.
Ask Genie:
What were my slowest queries in the last hour, and what made them slow?
Genie investigates using the same telemetry, walks through its reasoning, and proposes a fix that you confirm before it's applied.
How these fit together
You just used all three ways to work with your telemetry, and in practice they reinforce each other. The dashboards are your visual baseline: open them any time to see how the database is behaving and spot trends. Insights watches that same telemetry on a schedule and comes to you when something needs attention, so you don't have to keep checking. When an insight (or a question of your own) needs a closer look, Genie investigates conversationally and proposes a fix you confirm, and you can hand any insight straight to it with Fix with Genie. All three read the one set of Delta tables in your Unity Catalog, so there's nothing to keep in sync.
Next steps
-
- Configure observability
- Move beyond your own credentials: service principals, multiple projects, and workspace defaults.
-
- Find and resolve issues with Insights
- Tune how Insights evaluates your telemetry and learn how to read what it finds.
-
- Diagnose and fix issues with Genie
- Walk through a full conversational investigation and recovery with Genie.
-
- Use the observability dashboards
- Explore the same telemetry visually in ready-made dashboards.