OpenTelemetry export
This feature is in Beta. Workspace admins can control access to this feature from the Previews page. See Manage Databricks previews.
The OpenTelemetry integration sends Lakebase Postgres metrics and logs to any destination that accepts data using the OpenTelemetry Protocol (OTLP). You can use Grafana Cloud, New Relic, Datadog OTLP ingest, Honeycomb, or another OTLP-compatible backend.
This page describes how the integration works in Lakebase Autoscaling projects, how it relates to your Databricks workspace and the Lakebase App, and how to configure and verify export.
How it works
Lakebase runs a managed OpenTelemetry Collector for your project. The collector scrapes compute metrics, receives logs from your computes, and forwards them to the OTLP endpoint that you configure. Data reflects branches and computes in your project: metrics and logs are associated with the active computes that serve your endpoints.
If scale to zero suspends a compute, that compute doesn't emit metrics or logs until it runs again. You may see gaps during idle periods. To send data after setup, ensure computes are active—for example by running a query from the SQL editor or your application.
Metrics
Exported metrics include:
- Host / compute metrics — CPU and memory usage for the compute.
- SQL and database metrics — Connection counts, database size, replication delay, row activity, and related database statistics. These metric names are exported with a
lakebase_prefix (for example,lakebase_connection_counts).
Together, these match what you see in the in-product metrics dashboard, exported in OTLP form.
Exported metric names
The managed collector only forwards metrics that match its scrape and filter rules. Host metrics keep their original Prometheus-style names. PostgreSQL metrics have a lakebase_ prefix on export. Your observability backend may still add or change suffixes (for example _total) when it converts OTLP to another format.
Category | Included names (as sent toward OTLP) |
|---|---|
Host / compute | Series whose names match |
Connections |
|
Database size and limits |
|
Replication |
|
Local file cache (LFC) | Every series whose original name started with |
Logs
When enabled, logs (errors, warnings, connection-related events, and similar messages) are forwarded to your OTLP logs pipeline. Your configured service.name resource attribute identifies the logical service for logs in the backend.
Prerequisites
- A Lakebase project and access to the Lakebase App from your Databricks workspace. See Get started with Lakebase Postgres.
- A supported OTLP-capable observability backend and its base URL, plus credentials (API key, bearer token, or basic auth).
- Network path from Databricks-managed infrastructure to your OTLP endpoint (for example, a public HTTPS endpoint, or a collector reachable from your cloud environment).
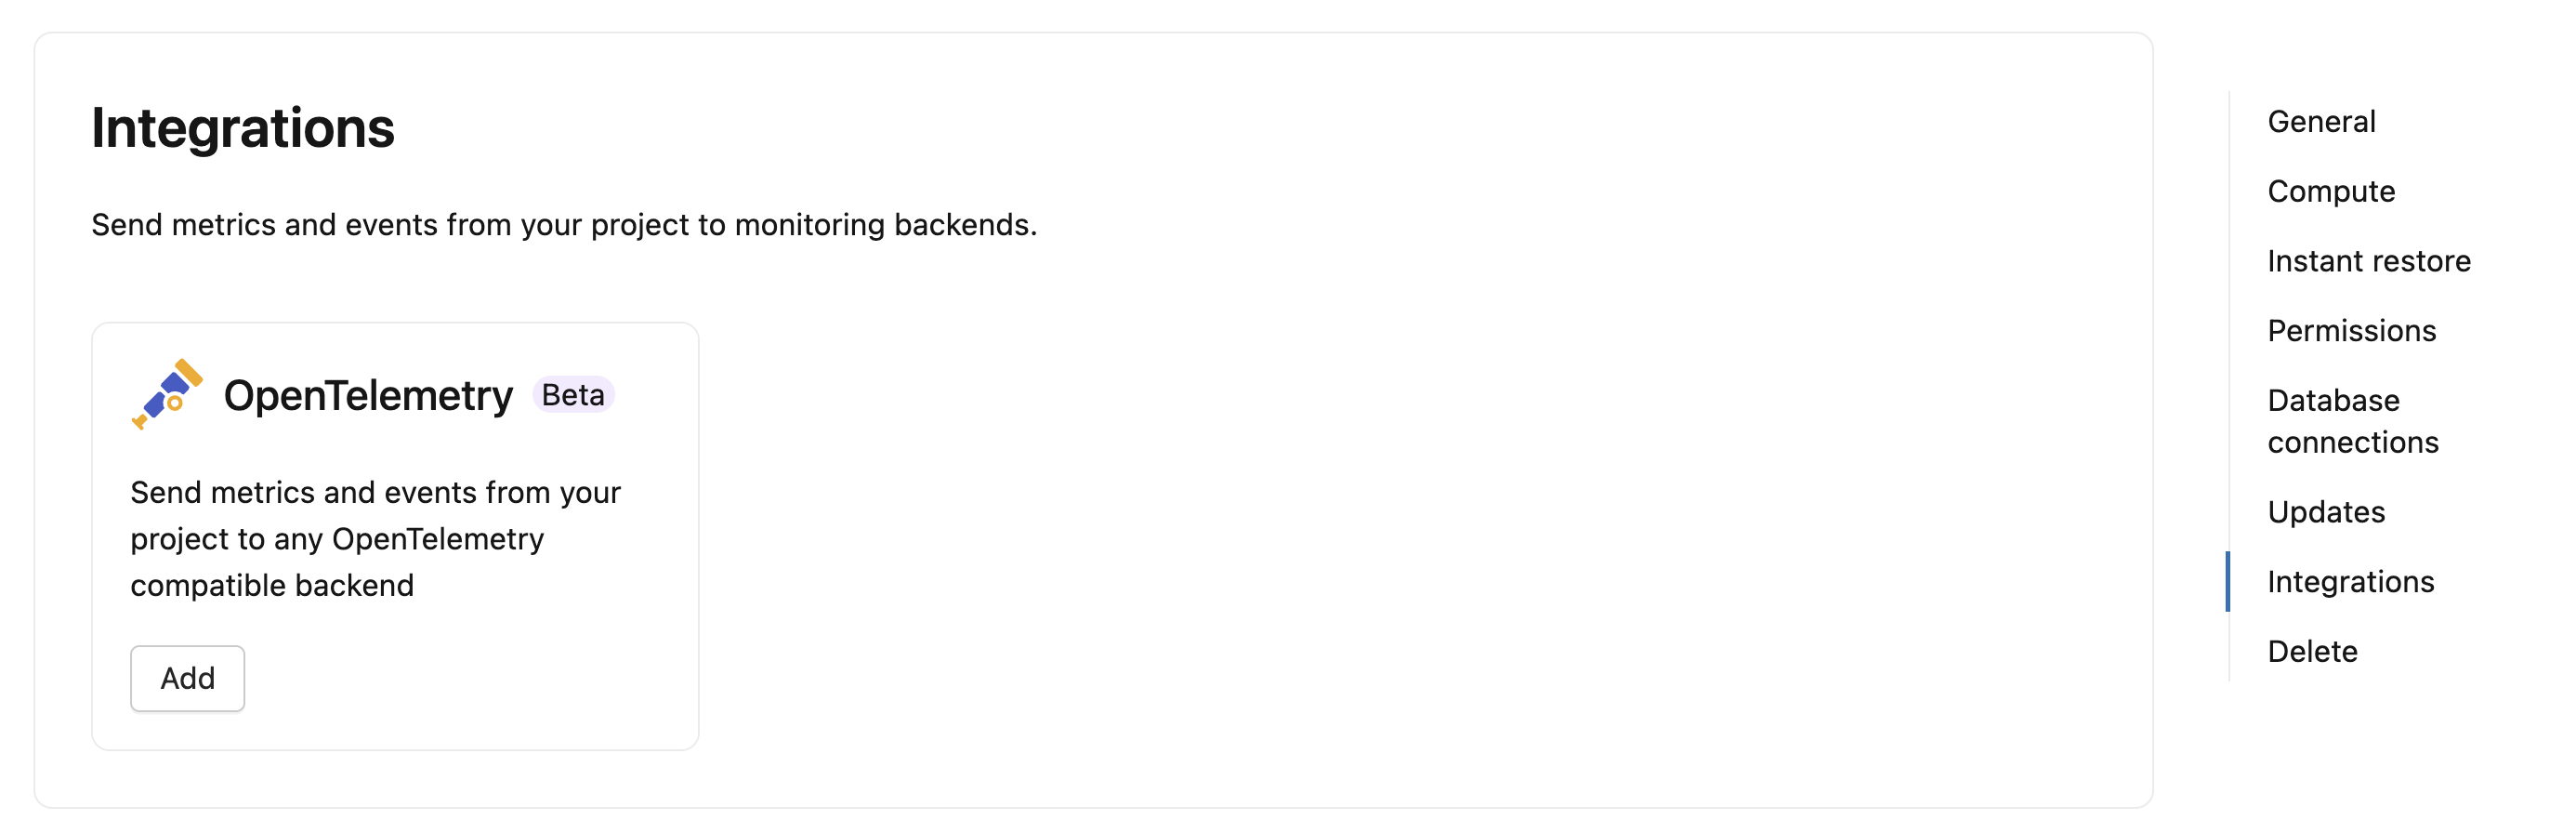
Open the OpenTelemetry configuration
- Open the Lakebase App for your workspace and select your project.
- Go to Settings for the project, then go to Integrations. The OpenTelemetry integration is available in the Integrations section.
- Alternatively, from the Monitoring page, select Export telemetry to open the project settings where you configure OpenTelemetry.
Configure connection protocol, endpoint, authentication, optional path overrides, and resource attributes in the form.
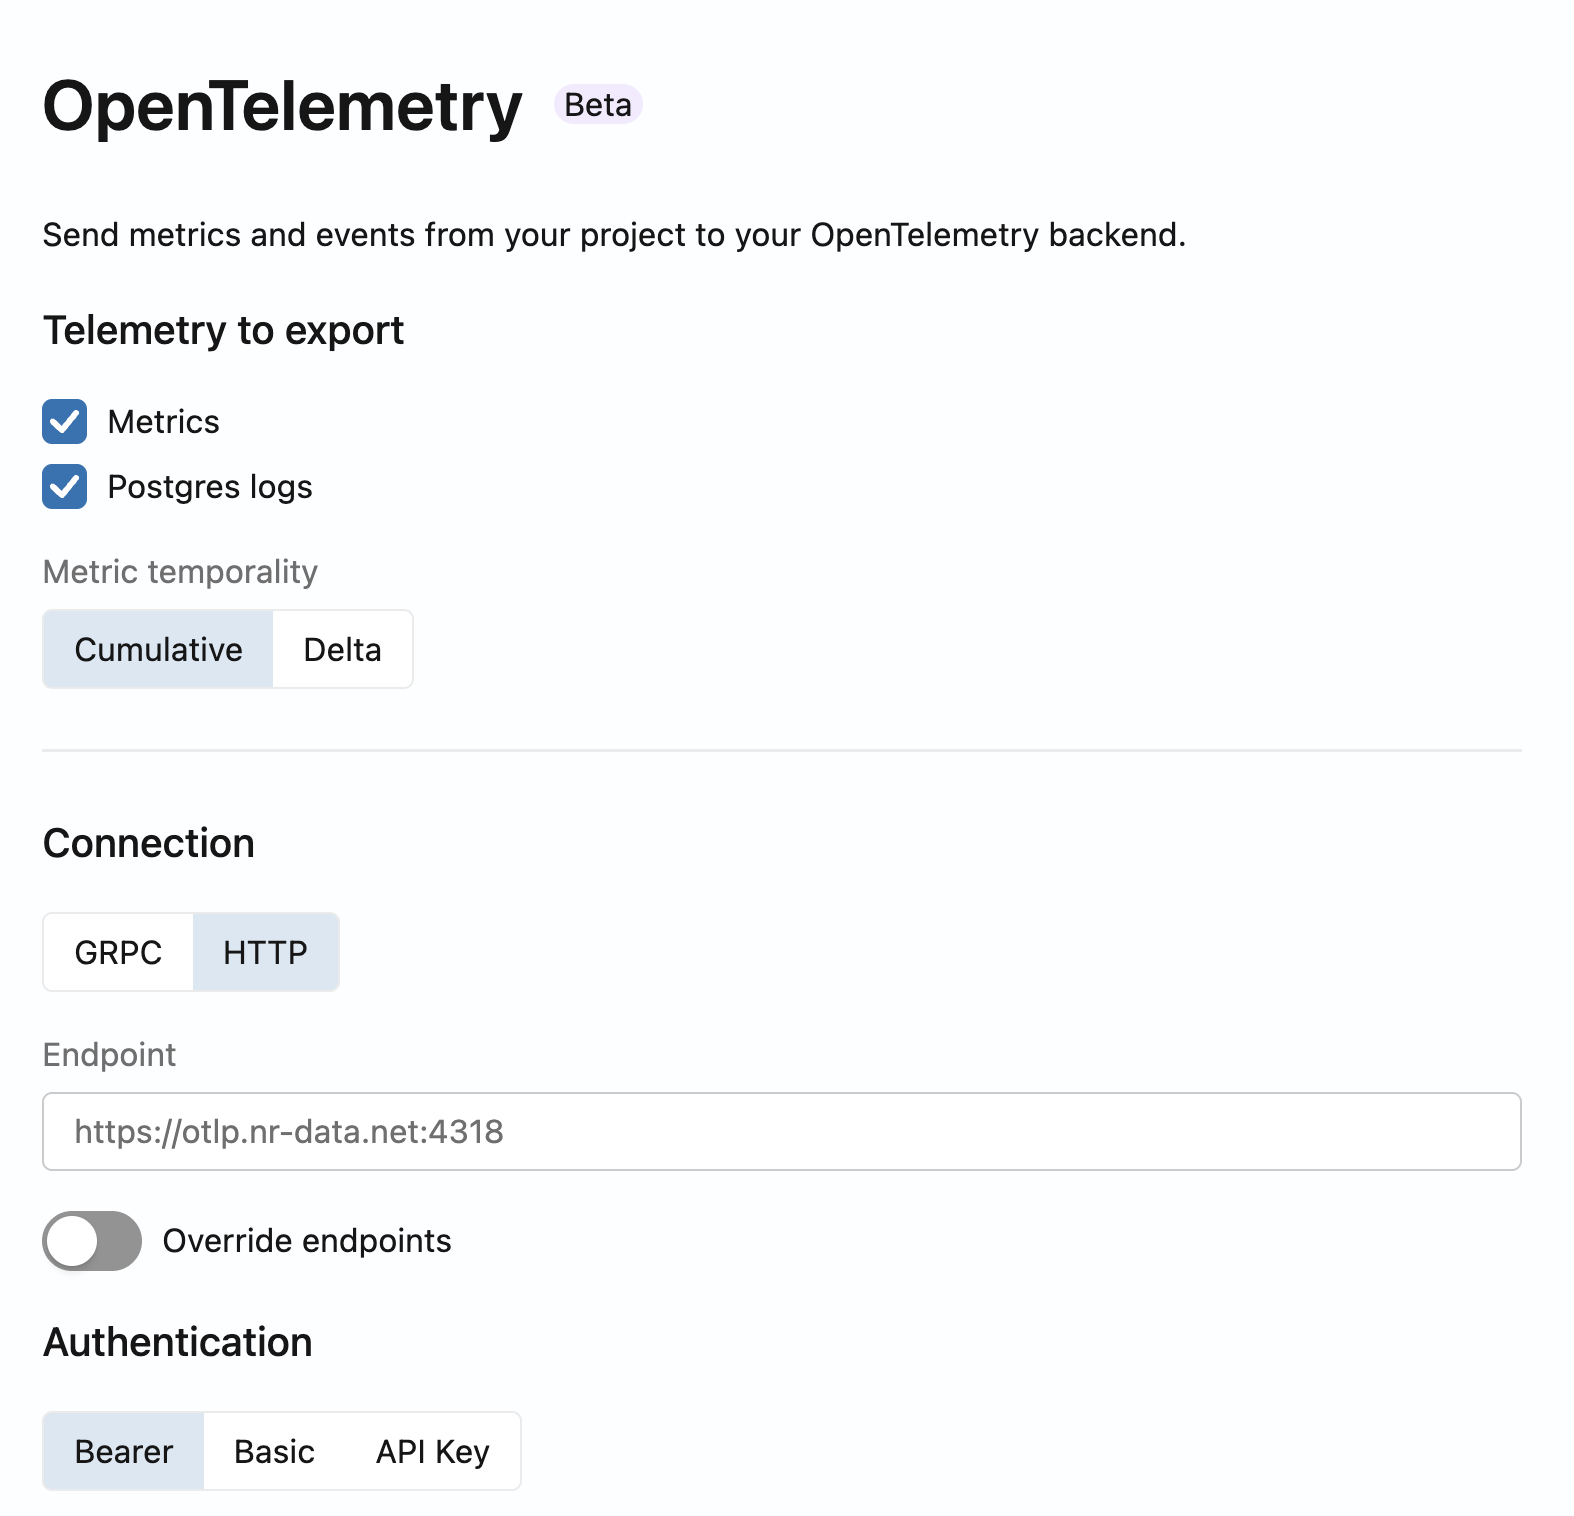
Select data to export
Choose one or both:
- Metrics — Host and SQL/database metrics as described above.
- Postgres logs — Log stream for observability and troubleshooting.
Configure the connection
-
Protocol — For most vendors, HTTP (OTLP over HTTP, typically on port 4318) is recommended. Use gRPC (typically port 4317) if your backend or network requires it.
-
Endpoint URL — Enter the base URL of your collector or vendor OTLP ingest endpoint without appending
/v1/metricsor/v1/logs. The collector appends the standard OTLP paths:/v1/metricsfor metrics/v1/logsfor logs
Examples:
- Grafana Cloud: use the OTLP gateway URL for your stack (often
https://otlp-gateway-<region>.grafana.net/otlp). See Grafana Cloud OpenTelemetry documentation for your region. - Datadog: use the OTLP ingest URL for your site as described in Datadog OpenTelemetry setup.
noteIf your platform expects metrics or logs on non-standard paths, use the optional endpoint overrides in the form (for example, custom paths for metrics or logs). Only set overrides when your vendor documentation requires it.
-
Authentication
- Bearer — Bearer token (some vendors use a license or ingest token).
- Basic — Username and password.
- API Key — API key value; you can set a custom header name if your backend expects something other than the default (some providers use vendor-specific header names).
Advanced options
- Delta metrics — Some backends expect delta temporality instead of cumulative counters. If your platform requires it, enable the option to convert cumulative metrics to delta temporality.
Configure resource attributes
Set service.name so you can identify this Lakebase project in your observability UI. Metrics are organized into logical streams such as compute-host-metrics (host metrics) and sql-metrics (database metrics), while Postgres logs are associated with the service name you configure.
Save and verify
Save the integration. Within a few minutes, data appears in your backend.
Vendor-specific configuration
Grafana Cloud
You can use the Grafana Cloud UI to obtain the OTLP endpoint URL and authentication values, then enter them in the Lakebase OpenTelemetry integration as described in Configure the connection.
Connections (guided setup with connection tiles)
- Sign in to the Grafana Cloud Portal.
- In Grafana, go to Connections, or expand the menu and choose Add new connection.
- Search for OpenTelemetry (OTLP). Follow the on-screen steps: choose OpenTelemetry SDK, Other as language and infrastructure and OpenTelemetry Collector as method.
- On the Instrumentation instructions page, create or choose a token to use for Lakebase OpenTelemetry export.
- Copy the connection details Grafana provides (
OTEL_EXPORTER_OTLP_ENDPOINTandOTEL_EXPORTER_OTLP_HEADERS).
Map Grafana values to Lakebase
- Protocol — Use HTTP unless Grafana or your network requires gRPC. The Grafana Cloud OTLP gateway commonly uses OTLP over HTTP.
- Endpoint URL — Use only the base OTLP URL (the value shown for
OTEL_EXPORTER_OTLP_ENDPOINTor the gateway URL on the OpenTelemetry page). Don't append/v1/metricsor/v1/logs; Lakebase adds those paths. Hostnames often followhttps://otlp-gateway-<region>.grafana.net/otlp; use the exact URL from your stack because region and hostname vary. - Authentication — Use the method Grafana documents for your token: Basic if Grafana gives a username and password (for example instance ID and token), Bearer for a bearer token, or API Key with a custom header name if Grafana specifies a non-default header. For Basic authentication, Grafana might provide a base64-encoded value that you need to decode before using.
For current UI labels, token formats, and architecture guidance, see Send data to the Grafana Cloud OTLP endpoint in the Grafana Cloud documentation.
Grafana Cloud navigation and tile names can change between releases. If a control is named differently in your portal, use in-product search or the linked Grafana documentation to find OTLP endpoint and authentication for your stack.
After data lands in Grafana Cloud, use Explore and Loki to verify you are receiving metrics and logs.
Datadog
You can send Lakebase metrics and logs to Datadog using its OTLP ingest endpoint. Datadog works best with delta temporality for counters and histograms. Enable the Delta metrics option in the Lakebase OpenTelemetry configuration.
Find your Datadog OTLP endpoint
The OTLP endpoint URL depends on your Datadog site. Common values:
Datadog site | OTLP endpoint (HTTP) |
|---|---|
US1 (datadoghq.com) |
|
US3 (us3.datadoghq.com) |
|
US5 (us5.datadoghq.com) |
|
EU1 (datadoghq.eu) |
|
AP1 (ap1.datadoghq.com) |
|
For other Datadog sites, see Datadog OTLP ingest in the Datadog documentation.
Map Datadog values to Lakebase
- Protocol — Use HTTP (OTLP over HTTP on port 4318). Datadog also supports gRPC (port 4317) if required by your network configuration.
- Endpoint URL — Enter the base OTLP URL for your Datadog site (see table above). Don't append
/v1/metricsor/v1/logs; Lakebase adds those paths automatically. - Authentication — Use API Key authentication. Enter your Datadog API key as the value and set the header name to
DD-API-KEY. - Delta metrics — Enable Delta metrics under Advanced options. Datadog expects delta temporality for counters and histograms. Without this setting, cumulative counters may produce incorrect rate calculations or duplicate counts in Datadog.
After data lands in Datadog, use Metrics Explorer to search for lakebase_ metrics and Logs to verify logs are arriving with your configured service.name.
Datadog applies its own naming conventions when it ingests OTLP data. For example, it may append .count or .sum to histogram metrics, or convert dots to underscores. See Datadog OTLP metric mapping for details on how metric names are transformed.
Troubleshooting
- No data — Confirm the OTLP URL, protocol, and credentials. Confirm the compute is not scaled to zero. Run a test query to wake the compute.
- HTTP 404 on export — Often means the backend doesn't accept OTLP at
{base}/v1/metricsor{base}/v1/logs. Confirm vendor docs or use path overrides if your platform uses non-standard paths. - Validation errors when saving — The product can test reachability of the OTLP endpoint. If validation fails, check firewall and TLS requirements, verify region URLs, and confirm that the backend supports OTLP HTTP or gRPC as selected.
For in-product metrics without external export, see Metrics dashboard. For client-only tools that connect over Postgres, see External monitoring tools.
Next steps
- Monitor Lakebase projects: Track performance, resource usage, and query analysis with built-in and external tools. See Monitor.
- View metrics: Check CPU, memory, connections, and database statistics in the in-product metrics dashboard. See Metrics dashboard.
- Connect external monitoring tools: Monitor your database with pgAdmin or PgHero using standard Postgres protocols. See External monitoring tools.