Monitor query performance
Monitor query performance for your Lakebase Postgres project to analyze historical query execution, identify slow queries, and find optimization opportunities.
View query performance
- From the Lakebase App, select your project.
- In the sidebar, select a branch.
- Go to Monitoring.
- Select the Query performance tab.
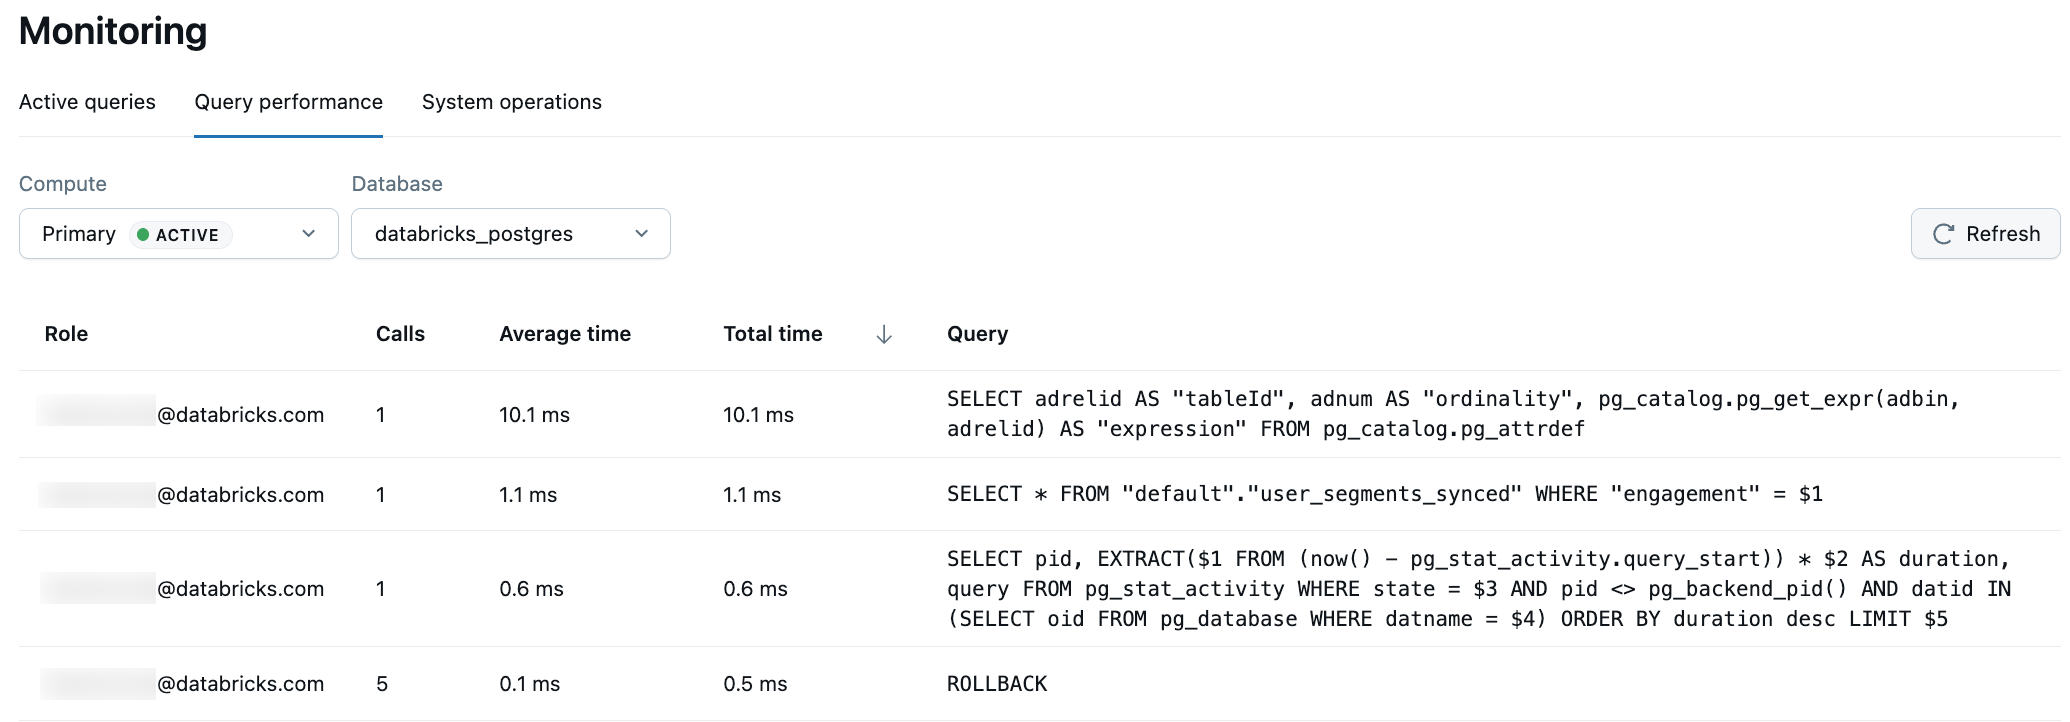
The Query performance view shows the top 100 previously run queries for the selected branch. Select the Compute and Database from the dropdowns, then use the Refresh button to load the latest query statistics.
This view uses the pg_stat_statements Postgres extension to track query execution statistics and performance patterns. Queries are grouped by their normalized form, meaning identical queries with different parameter values are aggregated into a single row.
Understanding the Query performance view
The Query performance table displays the following information for each query pattern:
- Role: The Postgres role that executed the query. This shows which database user or application account ran the queries.
- Calls: The number of times this query pattern has been executed. Use this to identify frequently run queries that may benefit from optimization.
- Average time: The mean execution time across all runs of this query. Click the column header to sort by average time and identify consistently slow queries.
- Total time: The cumulative execution time for all runs of this query. This helps you identify queries that consume the most database resources overall, even if individual executions are fast.
- Query: The normalized SQL statement. Parameter values are replaced with placeholders (e.g.,
$1,$2) to group similar queries together.
About pg_stat_statements
The Query performance view is powered by the pg_stat_statements Postgres extension, installed on a system managed database in your Postgres instance. Query history includes all queries run against your database, regardless of where they were issued from (SQL Editor, external clients, or applications).
Data collected by the pg_stat_statements extension is not retained when your compute is suspended or restarted. New data will be gathered once your compute restarts.
Run custom queries
To run your own queries on pg_stat_statements data, you can install the pg_stat_statements extension to your database and run your queries from the SQL Editor or any Postgres client such as psql. For details on pg_stat_statements, including how to install it, what data it collects, and queries you can run, see Monitor with pg_stat_statements.