Cost-based optimizer
Spark SQL uses a cost-based optimizer (CBO) to choose efficient query plans. The CBO uses table and column statistics, such as table size and data distribution, to estimate the cost of alternative plans and choose the plan with the lowest estimated cost. This matters most for queries with multiple joins, where a poor plan might be orders of magnitude slower than a good one.
The CBO is enabled by default, but it depends on statistics. If statistics are missing or stale, the CBO might choose an inefficient join order or join strategy. Collect table and column statistics and keep them up to date. See Collect statistics.
Best practices
To help the CBO choose efficient query plans, follow these practices:
- Collect statistics for tables used in multi-join queries. If you use predictive optimization on Unity Catalog managed tables, statistics are collected for you. See Collect statistics.
- Check query plans when a multi-join query is slower than expected. Missing or inaccurate statistics are a common cause. See Verify query plans.
- Drop statistics or disable the CBO only to mitigate a specific planning issue that statistics cause. See Disable the cost-based optimizer.
Collect statistics
To get the full benefit of the CBO it is important to collect both column statistics and table statistics. You can use the ANALYZE TABLE command to manually collect statistics.
To keep the statistics up-to-date, run ANALYZE TABLE after writing to the table.
Use ANALYZE
Predictive optimization automatically runs ANALYZE, a command for collecting statistics, on Unity Catalog managed tables. Databricks recommends enabling predictive optimization for all Unity Catalog managed tables to simplify data maintenance and reduce storage costs. See ANALYZE TABLE … COMPUTE STATISTICS.
You can remove optimizer statistics so the optimizer no longer relies on them, for example, to mitigate a planning issue caused by the statistics. See ANALYZE TABLE … DROP STATISTICS.
Verify query plans
There are several ways to verify the query plan.
EXPLAIN command
To check if the plan uses statistics, use the SQL command EXPLAIN.
If statistics are missing then the query plan might not be optimal.
== Optimized Logical Plan ==
Aggregate [s_store_sk], [s_store_sk, count(1) AS count(1)L], Statistics(sizeInBytes=20.0 B, rowCount=1, hints=none)
+- Project [s_store_sk], Statistics(sizeInBytes=18.5 MB, rowCount=1.62E+6, hints=none)
   +- Join Inner, (d_date_sk = ss_sold_date_sk), Statistics(sizeInBytes=30.8 MB, rowCount=1.62E+6, hints=none)
      :- Project [ss_sold_date_sk, s_store_sk], Statistics(sizeInBytes=39.1 GB, rowCount=2.63E+9, hints=none)
      :  +- Join Inner, (s_store_sk = ss_store_sk), Statistics(sizeInBytes=48.9 GB, rowCount=2.63E+9, hints=none)
      :     :- Project [ss_store_sk, ss_sold_date_sk], Statistics(sizeInBytes=39.1 GB, rowCount=2.63E+9, hints=none)
      :     :  +- Filter (isnotnull(ss_store_sk) && isnotnull(ss_sold_date_sk)), Statistics(sizeInBytes=39.1 GB, rowCount=2.63E+9, hints=none)
      :     :     +- Relation[ss_store_sk,ss_sold_date_sk] parquet, Statistics(sizeInBytes=134.6 GB, rowCount=2.88E+9, hints=none)
      :     +- Project [s_store_sk], Statistics(sizeInBytes=11.7 KB, rowCount=1.00E+3, hints=none)
      :        +- Filter isnotnull(s_store_sk), Statistics(sizeInBytes=11.7 KB, rowCount=1.00E+3, hints=none)
      :           +- Relation[s_store_sk] parquet, Statistics(sizeInBytes=88.0 KB, rowCount=1.00E+3, hints=none)
      +- Project [d_date_sk], Statistics(sizeInBytes=12.0 B, rowCount=1, hints=none)
         +- Filter ((((isnotnull(d_year) && isnotnull(d_date)) && (d_year = 2000)) && (d_date = 2000-12-31)) && isnotnull(d_date_sk)), Statistics(sizeInBytes=38.0 B, rowCount=1, hints=none)
            +- Relation[d_date_sk,d_date,d_year] parquet, Statistics(sizeInBytes=1786.7 KB, rowCount=7.30E+4, hints=none)
The rowCount statistic is especially important for queries with multiple joins. If rowCount is missing, it means there is not enough information to calculate it (that is, some required columns do not have statistics).
In Databricks Runtime 16.0 and above, the output of the EXPLAIN command lists the referenced tables that have missing, partial, and full stats, for example:
== Optimizer Statistics (table names per statistics state) ==
  missing = date_dim, store
  partial =
  full    = store_sales
Corrective actions: consider running the following command on all tables with missing or partial statistics
  ANALYZE TABLE <table-name> COMPUTE STATISTICS FOR ALL COLUMNS
Spark SQL UI
Use the Spark SQL UI page to see the executed plan and accuracy of the statistics.
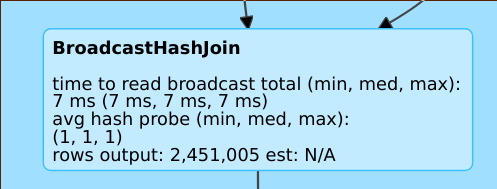
A line such as rows output: 2,451,005 est: N/A means that this operator produces approximately 2M rows and there were no statistics available.
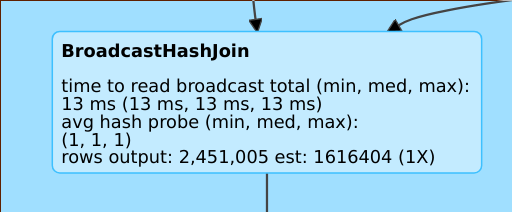
A line such as rows output: 2,451,005 est: 1616404 (1X) means that this operator produces approx. 2M rows, while the estimate was approx. 1.6M and the estimation error factor was 1.
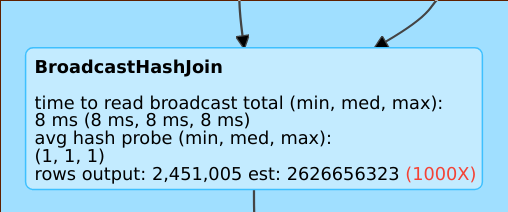
A line such as rows output: 2,451,005 est: 2626656323 means that this operator produces approximately 2M rows while the estimate was 2B rows, so the estimation error factor was 1000.
Disable the cost-based optimizer
The CBO is enabled by default. You disable the CBO by changing the spark.sql.cbo.enabled flag.
spark.conf.set("spark.sql.cbo.enabled", false)