Skew and spill
Spill
The first thing to look for in a long-running stage is whether there's spill.
At the top of the stage's page you'll see the details, which may include stats about spill:
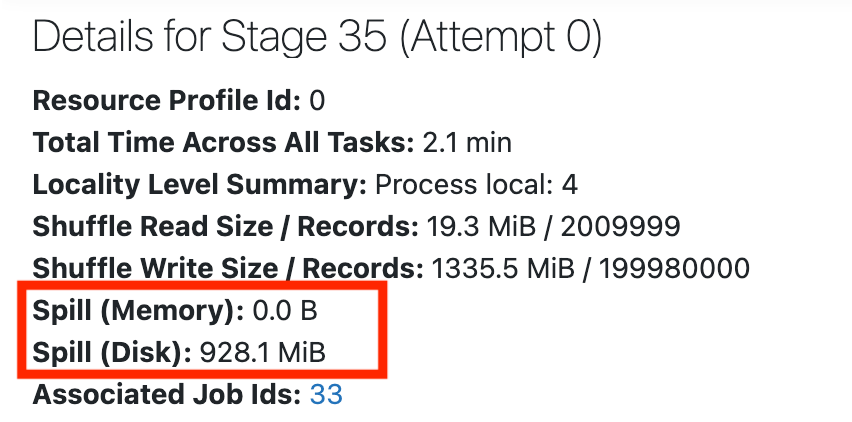
The stage details also include other metrics, such as Peak Execution Memory. For details about these and other stage metrics, see Stage detail in the Apache Spark documentation.
Spill is what happens when Spark runs low on execution memory. This memory is used for computations such as shuffles, joins, sorts, and aggregations. It starts to move data from memory to disk, which can be expensive. It is most common during data shuffling.
If you don't see any stats for spill, that means the stage doesn't have any spill. If the stage has some spill, see this guide on how to deal with spill caused by shuffle.
Skew
The next thing we want to look into is whether there's skew. Skew is when one or just a few tasks take much longer than the rest. This results in poor cluster utilization and longer jobs.
Scroll down to the Summary Metrics. The main thing we're looking for is the Max duration being much higher than the 75th percentile duration. The screenshot below shows a healthy stage, where the 75th percentile and Max are the same:
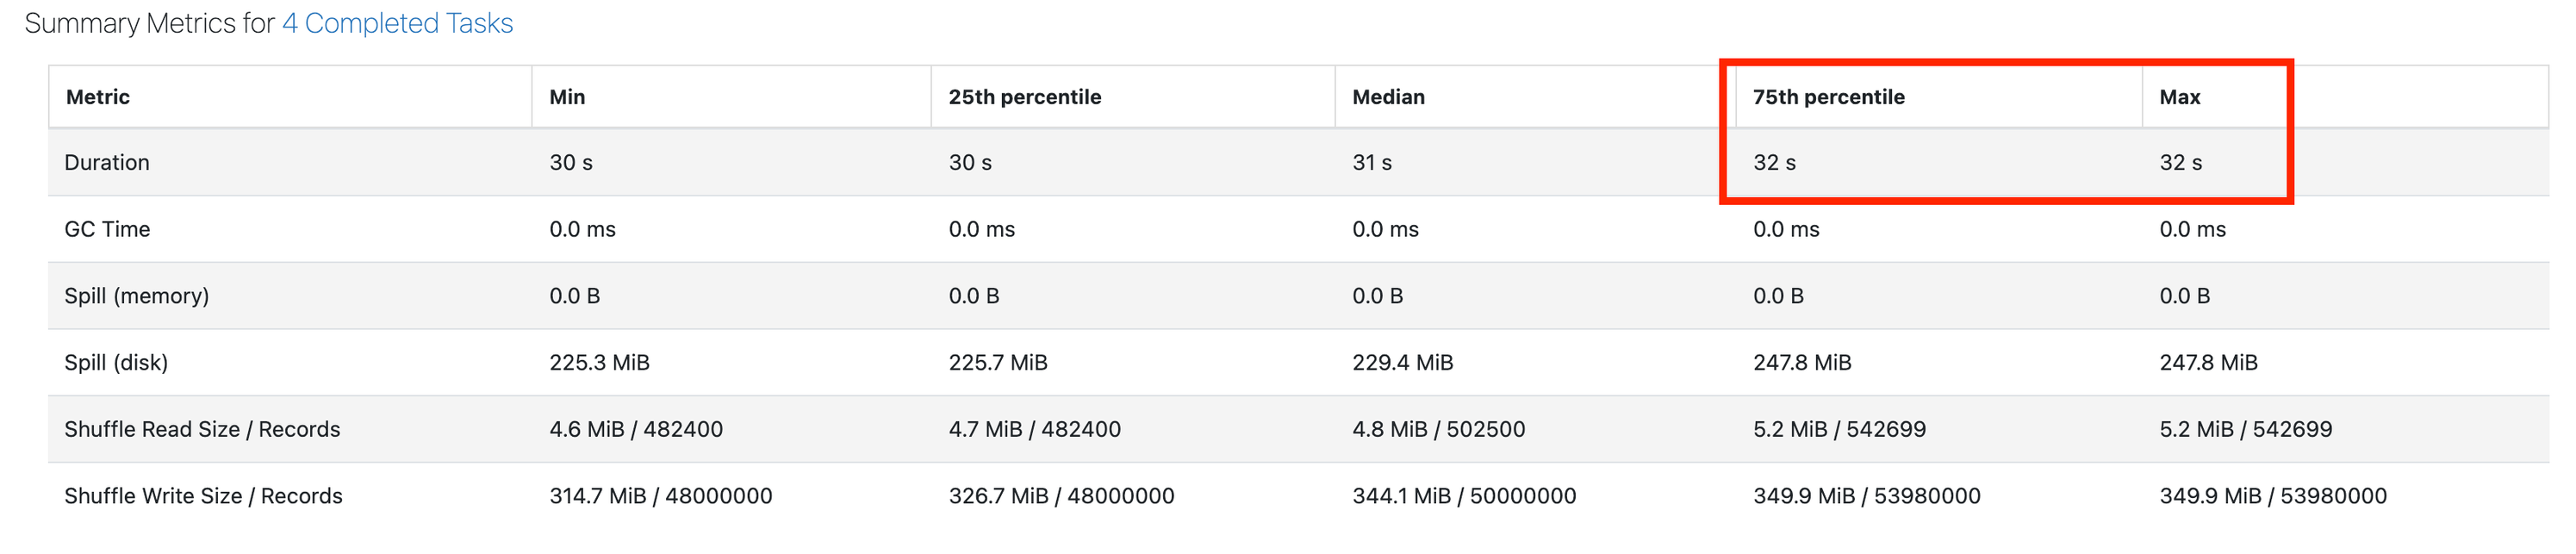
If the Max duration is 50% more than the 75th percentile, you may be suffering from skew.
If you see skew, learn about skew remediation steps here.
No skew or spill
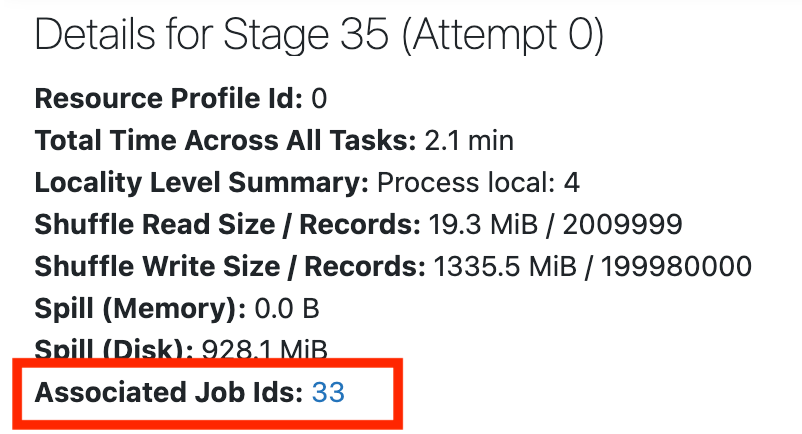
If you don't see skew or spill, go back to the job page to get an overview of what's going on. Scroll up to the top of the page and click Associated Job Ids:
If the stage doesn't have spill or skew, see Spark stage high I/O for the next steps.