Monitor coding agent usage
After you route coding agents through Unity Gateway, track their usage in the built-in dashboard, and optionally export OpenTelemetry metrics and logs to Unity Catalog managed Delta tables.
Dashboard
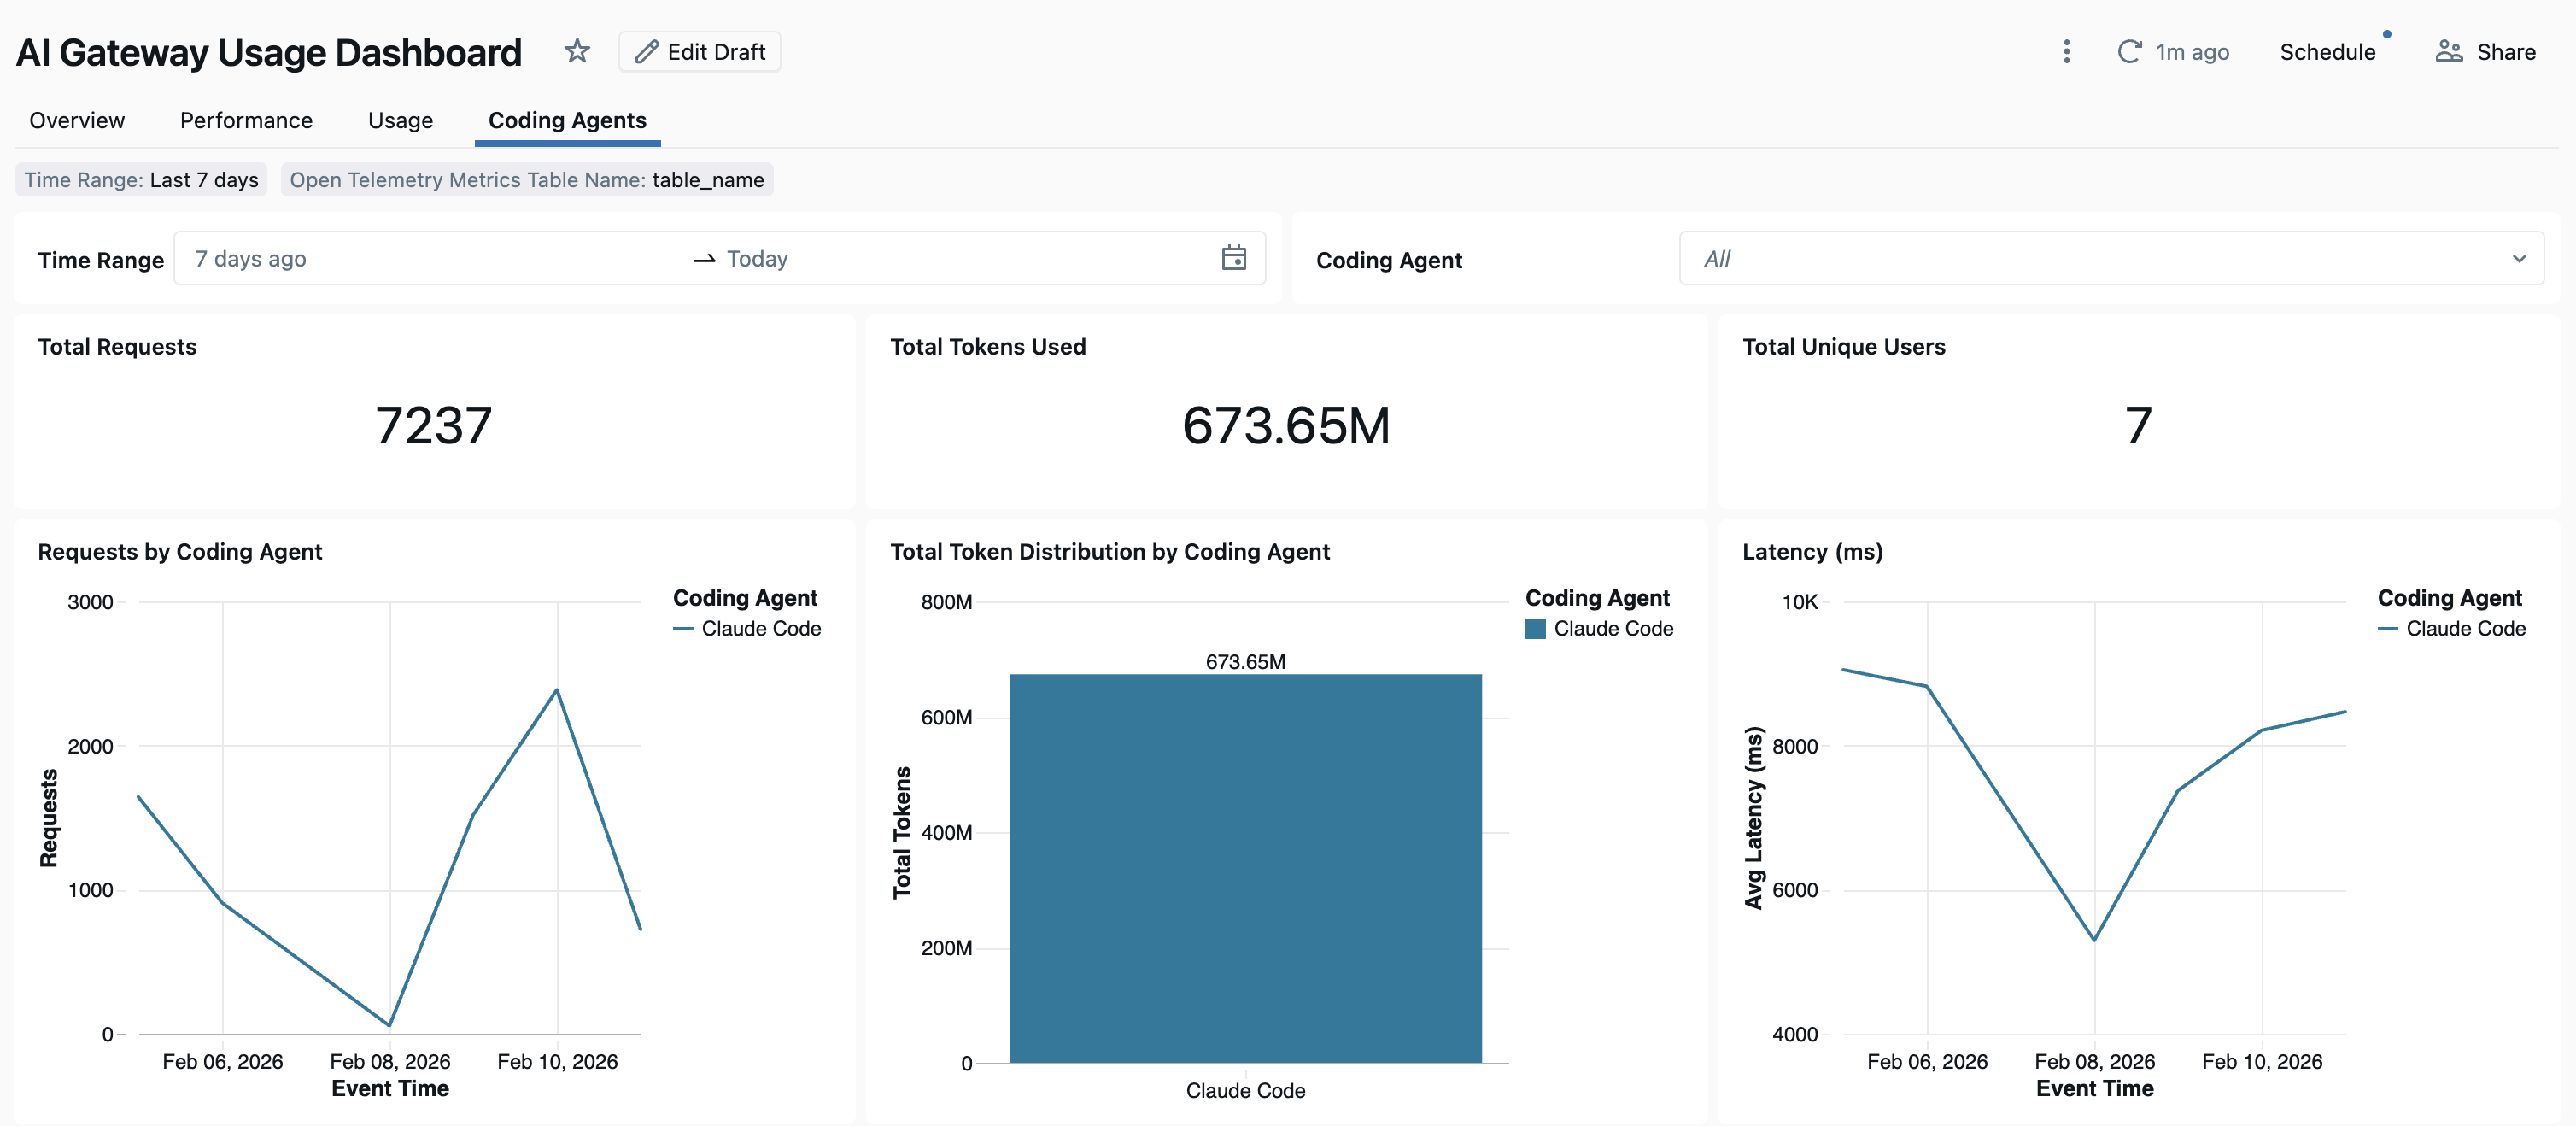
After coding agent usage is tracked through Unity Gateway, you can view and monitor your metrics in the built-in dashboard.
To open the dashboard, click Govern in the top right of the Unity Gateway page, then click Usage Dashboard. The built-in usage dashboard includes a Coding Agents tab with graphs for coding tool usage.
Set up OpenTelemetry data collection
Databricks supports exporting OpenTelemetry metrics and logs from coding agents to Unity Catalog managed Delta tables. All metrics are time series data exported using the OpenTelemetry standard metrics protocol, and logs are exported using the OpenTelemetry logs protocol.
Requirements
- OpenTelemetry on Databricks preview enabled. See Manage Databricks previews.
Step 1: Create OpenTelemetry tables in Unity Catalog
Create Unity Catalog managed tables preconfigured with the OpenTelemetry metrics and logs schemas.
Metrics table
CREATE TABLE <catalog>.<schema>.<table_prefix>_otel_metrics (
  name STRING,
  description STRING,
  unit STRING,
  metric_type STRING,
  gauge STRUCT<
    start_time_unix_nano: LONG,
    time_unix_nano: LONG,
    value: DOUBLE,
    exemplars: ARRAY<STRUCT<
      time_unix_nano: LONG,
      value: DOUBLE,
      span_id: STRING,
      trace_id: STRING,
      filtered_attributes: MAP<STRING, STRING>
    >>,
    attributes: MAP<STRING, STRING>,
    flags: INT
  >,
  sum STRUCT<
    start_time_unix_nano: LONG,
    time_unix_nano: LONG,
    value: DOUBLE,
    exemplars: ARRAY<STRUCT<
      time_unix_nano: LONG,
      value: DOUBLE,
      span_id: STRING,
      trace_id: STRING,
      filtered_attributes: MAP<STRING, STRING>
    >>,
    attributes: MAP<STRING, STRING>,
    flags: INT,
    aggregation_temporality: STRING,
    is_monotonic: BOOLEAN
  >,
  histogram STRUCT<
    start_time_unix_nano: LONG,
    time_unix_nano: LONG,
    count: LONG,
    sum: DOUBLE,
    bucket_counts: ARRAY<LONG>,
    explicit_bounds: ARRAY<DOUBLE>,
    exemplars: ARRAY<STRUCT<
      time_unix_nano: LONG,
      value: DOUBLE,
      span_id: STRING,
      trace_id: STRING,
      filtered_attributes: MAP<STRING, STRING>
    >>,
    attributes: MAP<STRING, STRING>,
    flags: INT,
    min: DOUBLE,
    max: DOUBLE,
    aggregation_temporality: STRING
  >,
  exponential_histogram STRUCT<
    attributes: MAP<STRING, STRING>,
    start_time_unix_nano: LONG,
    time_unix_nano: LONG,
    count: LONG,
    sum: DOUBLE,
    scale: INT,
    zero_count: LONG,
    positive_bucket: STRUCT<
      offset: INT,
      bucket_counts: ARRAY<LONG>
    >,
    negative_bucket: STRUCT<
      offset: INT,
      bucket_counts: ARRAY<LONG>
    >,
    flags: INT,
    exemplars: ARRAY<STRUCT<
      time_unix_nano: LONG,
      value: DOUBLE,
      span_id: STRING,
      trace_id: STRING,
      filtered_attributes: MAP<STRING, STRING>
    >>,
    min: DOUBLE,
    max: DOUBLE,
    zero_threshold: DOUBLE,
    aggregation_temporality: STRING
  >,
  summary STRUCT<
    start_time_unix_nano: LONG,
    time_unix_nano: LONG,
    count: LONG,
    sum: DOUBLE,
    quantile_values: ARRAY<STRUCT<
      quantile: DOUBLE,
      value: DOUBLE
    >>,
    attributes: MAP<STRING, STRING>,
    flags: INT
  >,
  metadata MAP<STRING, STRING>,
  resource STRUCT<
    attributes: MAP<STRING, STRING>,
    dropped_attributes_count: INT
  >,
  resource_schema_url STRING,
  instrumentation_scope STRUCT<
    name: STRING,
    version: STRING,
    attributes: MAP<STRING, STRING>,
    dropped_attributes_count: INT
  >,
  metric_schema_url STRING
) USING DELTA
TBLPROPERTIES (
  'otel.schemaVersion' = 'v1'
)
Logs table
CREATE TABLE <catalog>.<schema>.<table_prefix>_otel_logs (
  event_name STRING,
  trace_id STRING,
  span_id STRING,
  time_unix_nano LONG,
  observed_time_unix_nano LONG,
  severity_number STRING,
  severity_text STRING,
  body STRING,
  attributes MAP<STRING, STRING>,
  dropped_attributes_count INT,
  flags INT,
  resource STRUCT<
    attributes: MAP<STRING, STRING>,
    dropped_attributes_count: INT
  >,
  resource_schema_url STRING,
  instrumentation_scope STRUCT<
    name: STRING,
    version: STRING,
    attributes: MAP<STRING, STRING>,
    dropped_attributes_count: INT
  >,
  log_schema_url STRING
) USING DELTA
TBLPROPERTIES (
  'otel.schemaVersion' = 'v1'
)
Step 2: Update env vars in your coding agent
In any coding agent with OpenTelemetry metric support enabled, configure the following environment variables.
{
  "OTEL_METRICS_EXPORTER": "otlp",
  "OTEL_EXPORTER_OTLP_METRICS_PROTOCOL": "http/protobuf",
  "OTEL_EXPORTER_OTLP_METRICS_ENDPOINT": "https://<workspace-url>/api/2.0/otel/v1/metrics",
  "OTEL_EXPORTER_OTLP_METRICS_HEADERS": "content-type=application/x-protobuf,Authorization=Bearer <databricks_pat_token>,X-Databricks-UC-Table-Name=<catalog>.<schema>.<table_prefix>_otel_metrics",
  "OTEL_METRIC_EXPORT_INTERVAL": "10000",
  "OTEL_LOGS_EXPORTER": "otlp",
  "OTEL_EXPORTER_OTLP_LOGS_PROTOCOL": "http/protobuf",
  "OTEL_EXPORTER_OTLP_LOGS_ENDPOINT": "https://<workspace-url>/api/2.0/otel/v1/logs",
  "OTEL_EXPORTER_OTLP_LOGS_HEADERS": "content-type=application/x-protobuf,Authorization=Bearer <databricks_pat_token>,X-Databricks-UC-Table-Name=<catalog>.<schema>.<table_prefix>_otel_logs",
  "OTEL_LOGS_EXPORT_INTERVAL": "5000"
}
Step 3: Run your coding agent.
Your data should propagate to the Unity Catalog tables within 5 minutes.