How to monitor the quality of your external model on production traffic
This feature is in Public Preview.
This article describes an older product with limited functionality. Databricks recommends that you use Monitor GenAI in production instead.
This article describes how to monitor the quality of an external model on production traffic sent to a foundation model for which inference tables have been enabled using AI Gateway.
Online monitoring is a crucial aspect of ensuring that your model is working as intended with real-world requests. Using the notebook provided below, you can run Agent Evaluation continuously on the requests served through an external-model endpoint. The notebook generates a dashboard that displays quality metrics for your model's outputs on production requests. The dashboard enables you to slice the metrics by different dimensions, including by time, pass/fail status, and topic of the input request (for example, to understand whether specific topics are correlated with lower-quality outputs). Additionally, you can dive deeper into individual requests with low-quality responses to further debug them. All artifacts, such as the dashboard, are fully customizable.

Requirements
- Partner-powered AI features must be enabled for your workspace.
- Inference tables must be enabled through the AI Gateway for your endpoint.
Continuously process production traffic through Agent Evaluation
The following example notebook illustrates how to run Agent Evaluation on the request logs sent to a Foundational Model with Inference Tables enabled via AI Gateway. This includes external models such as OpenAI or provisioned throughput models. To run the notebook follow these steps:
…
- Import the notebook in your workspace (instructions). You can click on the “Copy link for import” button below to get a URL for the import.
- Fill in the required parameters at the top of the imported notebook.
- The name of your serving endpoint with Inference Tables enabled via AI Gateway.
- A sample rate between 0.0 and 1.0 to sample requests. Use a lower rate for endpoints with high amounts of traffic.
- (Optional) A workspace folder to store generated artifacts (such as dashboards). The default is the home folder.
- (Optional) A list of topics to categorize the input requests. The default is a list consisting of a single catch-all topic.
- Click Run all in the imported notebook. This will do an initial processing of your production logs within a 30-day window and initialize the dashboard that summarizes the quality metrics.
- Click Schedule to create a job to run the notebook periodically. The job will incrementally process your production logs and keep the dashboard up to date.
The notebook requires either serverless compute or a cluster running Databricks Runtime 15.2 or above. When continuously monitoring production traffic on endpoints with a large number of requests, we recommend setting a more frequent schedule. For instance, an hourly schedule would work well for an endpoint with more than 10,000 requests per hour and a 10% sample rate.
Run Agent Evaluation on production traffic notebook
Create alerts on evaluation metrics
After you schedule the notebook to run periodically, you can add alerts to be notified when quality metrics dip lower than expected. These alerts are created and used the same way as other Databricks SQL alerts. First, create a Databricks SQL query on the evaluation requests log table generated by the example notebook. The following code shows an example query over the evaluation requests table, filtering requests from the past hour:
SELECT
  `request_date`,
  AVG(pass_indicator) as avg_pass_rate
FROM (
  SELECT
    *,
    CASE
      WHEN `response/overall_assessment/rating` = 'yes' THEN 1
      WHEN `response/overall_assessment/rating` = 'no' THEN 0
      ELSE NULL
    END AS pass_indicator
  -- The eval requests log table is generated by the example notebook
  FROM {eval_requests_log_table_name}
  WHERE `request_date` >= CURRENT_TIMESTAMP() - INTERVAL 1 DAY
)
GROUP BY ALL
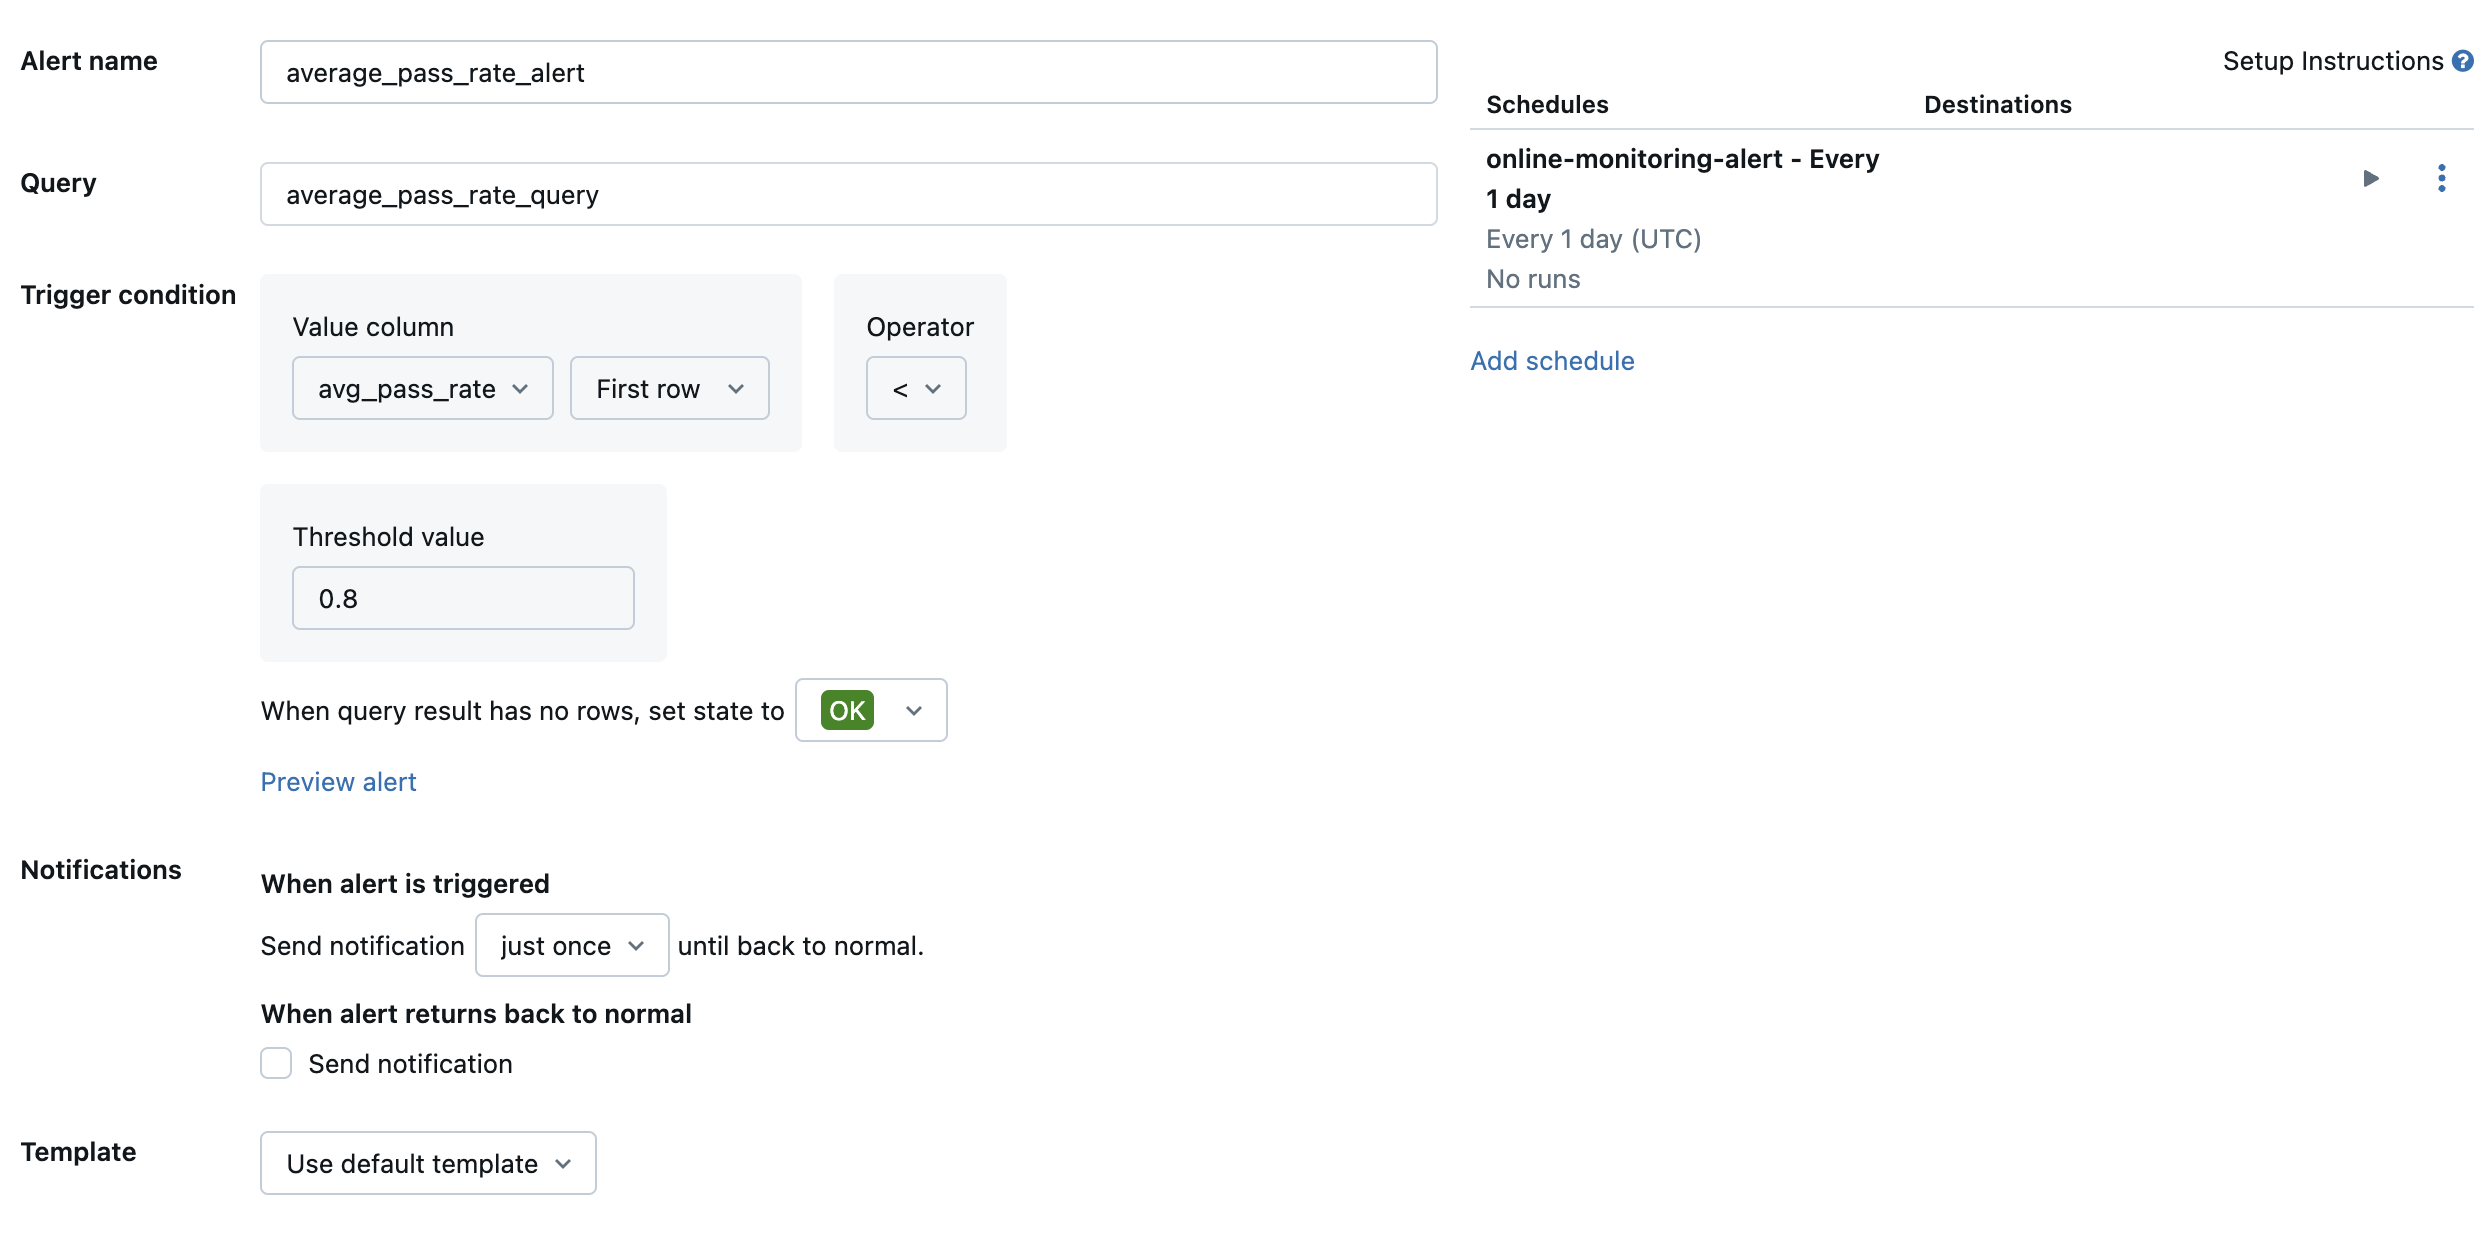
Then, create a Databricks SQL alert to evaluate the query at a desired frequency, and send a notification if the alert is triggered. The following image shows an example configuration to send an alert when the overall pass rate falls below 80%.
By default, an email notification is sent. You can also set up a webhook or send notifications to other applications such as Slack or PagerDuty.