Create a metric view
This page explains the data model and considerations used in the examples showing how to create a metric view using SQL or the UI.
Sample dataset overview
The examples provided in Use SQL to create and manage metric views and Create a metric view using the Catalog Explorer UI use the TPC-H dataset, which is available by default in Unity Catalog datasets.
The TPC-H dataset is a standard benchmark dataset used to evaluate decision support systems and query performance. It models a wholesale supply chain business and is structured around common business operations such as orders, customers, suppliers, and parts. It represents a sales and distribution environment, where customers place orders for parts supplied by various suppliers across different nations and regions.
The schema has 8 tables:
-
REGIONandNATION: These tables define the location. -
CUSTOMERandSUPPLIER: These tables describe business entities. -
PARTandPARTSUPP: These tables capture product information and supplier availability. -
ORDERSandLINEITEM: These tables represent transactions, with line items detailing products within orders.
TPC-H dataset ERD
The following diagram explains the relationships between the tables.
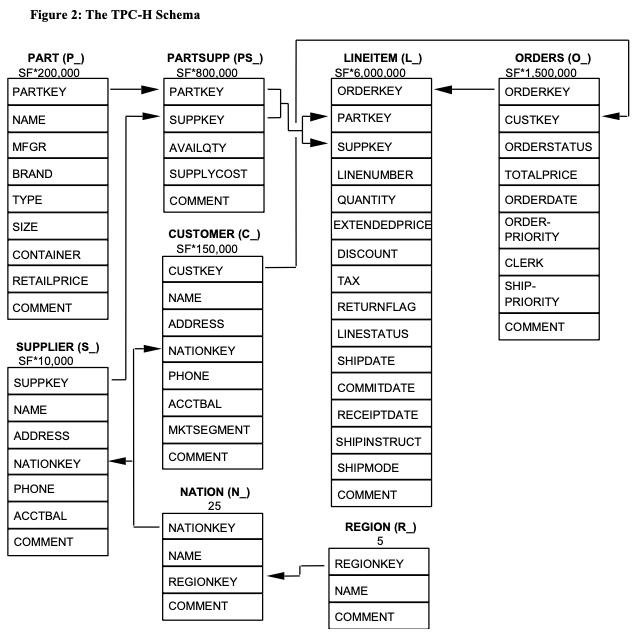
Legend:
- The parentheses following each table name contain the prefix of the column names for that table;
- The arrows point in the direction of the one-to-many relationships between tables;
- The number/formula below each table name represents the cardinality (number of rows) of the table. Some are factored by SF, the Scale Factor, to obtain the chosen database size. The cardinality for the LINEITEM table is approximate (see Clause 4.2.5).
(source: TPC Benchmark H Standard Specification)
Define a metric view
You can define a metric view using SQL DDL or the Catalog Explorer UI. Alternatively, Databricks Assistant can help you get started creating your metric view. Then, you can edit the provided SQL DDL or use the metric view editor in the UI to refine the suggested definition.
The metric view defined for the examples in this section is designed for a sales or financial analyst to monitor key performance indicators (KPIs) related to the company's orders. It can help answer questions such as:
- How has our total revenue trended over time?
- What is the current breakdown of our orders by status (Open, Processing, Fulfilled)?
- Which order priorities generate the most revenue?
- How much revenue is currently 'at risk' or outstanding (i.e., from Open orders)?
- What is the average revenue generated per unique customer?
The necessary components are described in the following table:
Component | YAML field/expression | Business meaning |
|---|---|---|
Source table |
| The raw data containing customer order records. |
Filter |
| Focuses analysis only on orders placed after January 1, 1990, likely excluding historical or archived data. |
Dimension: Order Month |
| Enables trend analysis (Month over month/Year over year), tracking how performance changes over time. |
Dimension: Order Status |
| Allows segmentation by lifecycle stage, helpful for fulfillment and backlog management. |
Dimension: Order Priority |
| Used to group performance by the strategic importance or urgency of the order. |
Measure: Order Count |
| Measures the volume sales activity |
Measure: Total Revenue |
| The gross sales value of all orders |
Measure: Total Revenue per Customer |
| A customer value metric useful for assessing customer transaction quality. |
Measure: Total Revenue for Open Orders |
| The value of unearned revenue or the current sales backlog. Used for forecasting and risk assessment. |
Ask Databricks Assistant
Databricks Assistant can help you get started defining a metric view.
- Click
 the Assistant icon in the upper-right corner of your Databricks workspace to open the assistant.
 - Type a description of the metric view that you want to create. The Assistant returns SQL DDL that attempts to match your request.
- Copy the provided SQL and paste it into the SQL editor. Then, click Run.
- Edit the SQL or open the metric view editor to make adjustments.
Create a new metric view
Use one of the following examples to create a new metric view: