Visualizações personalizadas em dashboards de AI/BI
Visualização
Esse recurso está em Prévia Pública.
Visualizações personalizadas permitem personalizar gráficos em dashboards de AI/BI além dos tipos de visualização integrados. Visualizações personalizadas usam a biblioteca Vega-Lite para renderizar gráficos a partir de uma especificação JSON.
Criar uma visualização personalizada
- Selecione um dataset.
- No painel de configuração de visualização, selecione Visualização Personalizada na seção de visualização Avançada .
- Na seção **Campos**, adicione os campos que deseja usar. Cada campo possui um Nome exclusivo. Faça referência aos campos em sua especificação Vega-Lite utilizando estes nomes.
- Insira sua especificação JSON Vega-Lite no editor Especificação Vega-Lite .
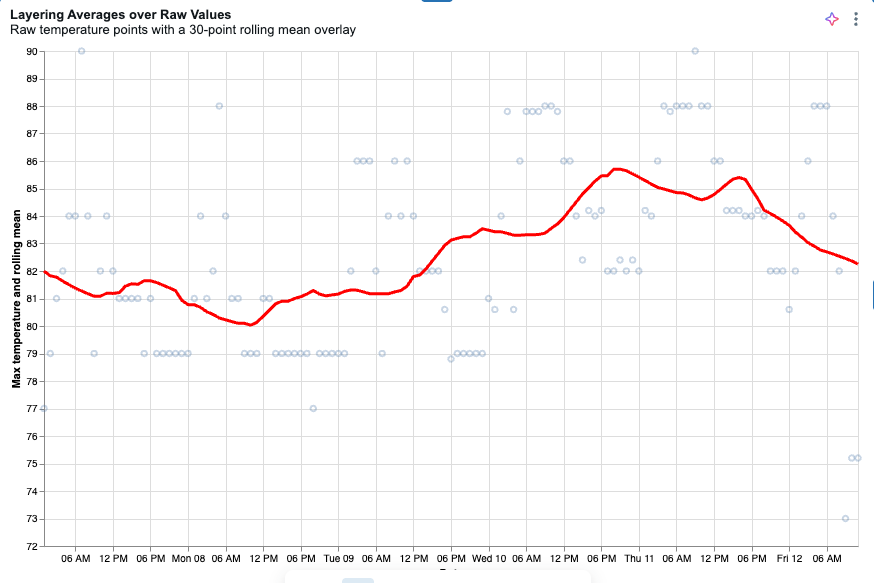
Exemplo de gráfico em camadas com média móvel
Este exemplo cria um gráfico em camadas que grafica pontos de dados de temperatura brutos com uma sobreposição de linha de média móvel, usando dados meteorológicos dos conjuntos de dados de amostra do Databricks.
-
Crie um dataset com a seguinte query:
SQLSELECT date, temperature AS temp_max
FROM samples.accuweather.historical_hourly_imperial
WHERE city_name = 'singapore'
ORDER BY date -
No painel de configuração da visualização, em Avançado , selecione Visualização Personalizada .
-
Selecione o dataset criado n'o passo anterior.
-
Na seção Campos , adicione um campo para a coluna de data e defina seu Nome como
date. -
Adicionar um campo para a coluna de temperatura e defina seu **Nome**
temp_maxpara. -
Copie a especificação a seguir no editor de especificação Vega-Lite . Se o eixo X estiver cortado, consulte Fazer um gráfico redimensionar automaticamente.
especificação JSON
{
  "$schema": "https://vega.github.io/schema/vega-lite/v5.json",
  "width": "container",
  "height": "container",
  "config": {
    "autosize": { "type": "fit", "contains": "padding" }
  },
  "data": { "name": "databricks_query" },
  "transform": [
    {
      "window": [{ "field": "temp_max", "op": "mean", "as": "rolling_mean" }],
      "frame": [-15, 15]
    }
  ],
  "encoding": {
    "x": { "field": "date", "type": "temporal", "title": "Date" },
    "y": {
      "type": "quantitative",
      "scale": { "zero": false },
      "axis": { "title": "Max temperature and rolling mean" }
    }
  },
  "layer": [
    {
      "mark": { "type": "point", "opacity": 0.3 },
      "encoding": { "y": { "field": "temp_max", "title": "Max temperature" } }
    },
    {
      "mark": { "type": "line", "color": "red", "size": 3 },
      "encoding": { "y": { "field": "rolling_mean", "title": "Rolling mean of max temperature" } }
    }
  ]
}
Referenciar colunas de dataset
Há duas maneiras de fazer referência a colunas em uma especificação Vega-Lite:
-
Use
"field": "{columnName}". O exemplo a seguir atribui a colunaxFieldao eixo X:JSON"encoding": {
"x": { "field": "xField", "type": "quantitative" }
} -
Em expressões, use
datum["{columnName}"]oudatum.{columnName}. O exemplo a seguir define uma nova colunaxa partir das colunasreangle.JSON{ "calculate": "datum.r * cos(datum.angle)", "as": "x" }
Para obter mais informações, consulte datum na documentação de expressões Vega.
Herdar o tema do dashboard
As visualizações personalizadas adaptam-se automaticamente ao tema do dashboard, incluindo o modo claro e escuro. Os seguintes elementos do gráfico herdam os valores do tema sem qualquer alteração na sua especificação:
- As fontes do eixo, legenda, título e cabeçalho correspondem às fontes configuradas do painel.
- As linhas de grade do eixo correspondem à cor da linha de grade do dashboard para o modo ativo.
- O plano de fundo do gráfico é transparente sobre o plano de fundo temático do widget.
As configurações que você define no bloco config da sua especificação têm precedência sobre os valores default herdados.
Referenciar valores do tema em expressões
Para estilizar marcas com valores cientes de temas, referencie os seguintes sinais dentro de uma expressão Vega-Lite ({ "expr": "..." }):
Sinal | Descrição |
|---|---|
| Tokens de cor pré-resolvidos para o modo ativo. Use-os para valores comuns como |
| O modo de cor ativo: |
| O tema completo configurado pelo proprietário do painel, incluindo fontes ( |
Os sinais colors e dashboardTheme são independentes. colors fornece tokens de conveniência resolvidos para o modo ativo, enquanto dashboardTheme expõe o tema completo configurado pelo proprietário. Use colors primeiro e use dashboardTheme para fontes, a paleta completa ou qualquer valor que colors não forneça.
Os exemplos a seguir mostram como referenciar valores de tema.
-
Use a fonte principal do painel para uma marca de texto:
JSON{ "expr": "dashboardTheme.resolvedFontSettings.fieldValue.fontFamily" } -
Use a cor do título do painel para o modo ativo:
JSON{ "expr": "dashboardTheme.resolvedFontSettings.fieldTitle.fontColor[mode]" } -
Use uma cor da paleta categórica do painel:
JSON{ "expr": "dashboardTheme.visualizationColors[0]" }
Como colors tokens já foram resolvidos para o modo ativo, não os indexe com [mode]. Use colors.markHighlightColor, não colors.markHighlightColor[mode]. Os campos em dashboardTheme que fornecem variantes por modo, como dashboardTheme.gridLineColor[mode], exigem o índice [mode].
Filtrar outros widgets na seleção
Uma visualização personalizada pode atuar como uma fonte de filtro cruzado: quando um usuário clica em uma marca, a seleção filtra os outros widgets no dashboard. Para habilitar isso, adicione um parâmetro de seleção de ponto com o nome reservado databricks_mark_selection. O renderizador detecta esse nome e conecta a seleção ao estado de filtro cruzado do dashboard.
"params": [
  {
    "name": "databricks_mark_selection",
    "select": { "type": "point", "fields": ["categoryName"] }
  }
]
Os seguintes requisitos aplicam-se:
- O parâmetro
namedeve ser exatamentedatabricks_mark_selection. Qualquer outro nome é tratado como um parâmetro regular e não impulsiona a filtragem cruzada. select.typedeve serpoint. Seleções de intervalo (pincel) não são suportadas como fontes de filtro cruzado.select.fieldsdeve listar os nomes dos campos definidos na seção Campos da configuração do widget, e não os nomes das colunas brutas.- Liste apenas os campos de dimensão (agrupamento) em
select.fields. Medidas agregadas, comoSUM(...)ouAVG(...), não podem acionar um filtro cruzado. - Para selecionar vários campos, liste-os juntos:
"fields": ["categoryName", "regionName"].
Destacar marcas selecionadas
Para destacar marcas selecionadas, use as condições stroke e strokeWidth em uma marca baseada em preenchimento (como bar, arc ou rect) e mantenha a codificação color vinculada ao seu campo. Use { "expr": "colors.markHighlightColor" } para o traço para que o destaque permaneça legível nos modos claro e escuro.
O exemplo a seguir filtra o restante do painel por categoryName quando uma barra é clicada. Barras selecionadas recebem um contorno temático, e barras não selecionadas esmaecem mantendo sua codificação de cor.
especificação JSON
{
  "$schema": "https://vega.github.io/schema/vega-lite/v6.json",
  "data": { "name": "databricks_query" },
  "width": "container",
  "height": "container",
  "config": { "autosize": { "type": "fit", "contains": "padding" } },
  "params": [
    {
      "name": "databricks_mark_selection",
      "select": { "type": "point", "fields": ["categoryName"] }
    }
  ],
  "mark": { "type": "bar", "stroke": null },
  "encoding": {
    "x": { "field": "categoryName", "type": "nominal" },
    "y": { "field": "salesValue", "type": "quantitative" },
    "color": { "field": "categoryName", "type": "nominal" },
    "fillOpacity": {
      "condition": { "param": "databricks_mark_selection", "value": 1 },
      "value": 0.3
    },
    "stroke": {
      "condition": {
        "param": "databricks_mark_selection",
        "empty": false,
        "value": { "expr": "colors.markHighlightColor" }
      },
      "value": null
    },
    "strokeWidth": {
      "condition": { "param": "databricks_mark_selection", "empty": false, "value": 2 },
      "value": 0
    }
  }
}
Redimensionar um gráfico automaticamente
Para redimensionar um gráfico para que se ajuste ao seu contêiner, adicione as seguintes configurações no nível superior da sua especificação:
"width": "container",
"height": "container",
"config": {
  "autosize": {
    "type": "fit",
    "contains": "padding"
  }
}
Exemplo de especificações de gráfico
As especificações a seguir mostram gráficos que não estão disponíveis como tipos de visualização integrada. Para ver mais exemplos, consulte as galerias de exemplos do Vega-Lite.
Tabela de marcadores
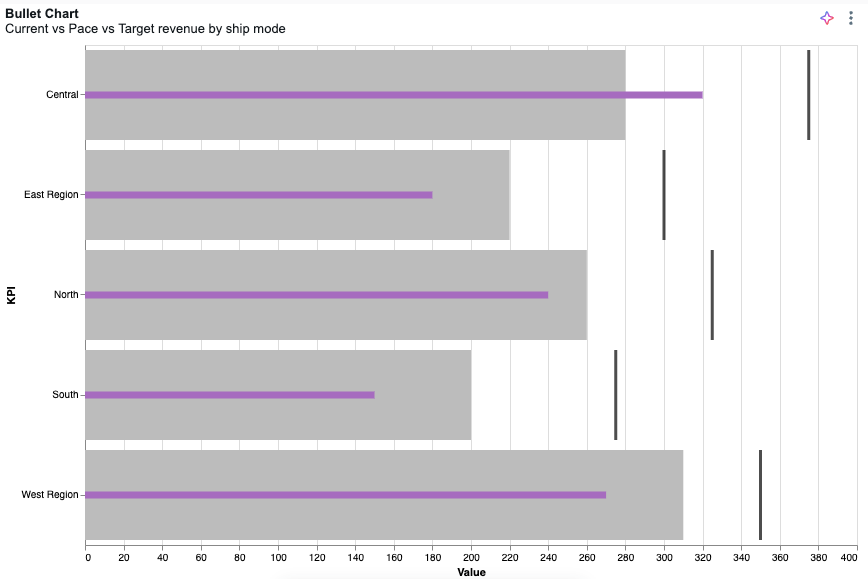
Definir categoryField, currentField, paceField e targetField na seção Campos .
especificação JSON
{
  "$schema": "https://vega.github.io/schema/vega-lite/v5.json",
  "width": "container",
  "height": "container",
  "data": { "name": "databricks_query" },
  "config": {
    "autosize": { "type": "fit", "contains": "padding" }
  },
  "transform": [
    {
      "fold": ["targetField", "paceField", "currentField"],
      "as": ["measure_name", "measure_value"]
    },
    {
      "calculate": "toNumber(datum.measure_value)",
      "as": "measure_value"
    },
    {
      "calculate": "{ \"targetField\": \"Target\", \"paceField\": \"Pace\", \"currentField\": \"Current\" }[datum.measure_name]",
      "as": "measure_label"
    },
    {
      "calculate": "indexof([\"Target\", \"Pace\", \"Current\"], datum.measure_label)",
      "as": "measure_order"
    }
  ],
  "layer": [
    {
      "mark": "bar",
      "params": [
        {
          "name": "legend_click",
          "select": { "type": "point", "fields": ["measure_label"] },
          "bind": "legend"
        }
      ],
      "encoding": {
        "color": { "field": "measure_label" },
        "opacity": { "value": 0 }
      }
    },
    {
      "transform": [{ "filter": { "param": "legend_click" } }],
      "layer": [
        {
          "layer": [
            {
              "mark": { "type": "bar", "tooltip": true },
              "encoding": { "color": { "field": "measure_label", "legend": null } },
              "transform": [{ "filter": { "field": "measure_label", "oneOf": ["Pace"] } }]
            },
            {
              "mark": { "type": "bar", "height": 7, "tooltip": true },
              "encoding": { "color": { "field": "measure_label", "legend": null } },
              "transform": [{ "filter": { "field": "measure_label", "oneOf": ["Current"] } }]
            },
            {
              "mark": { "type": "tick", "tooltip": true, "thickness": 3 },
              "encoding": { "color": { "field": "measure_label", "legend": null } },
              "transform": [{ "filter": { "field": "measure_label", "oneOf": ["Target"] } }]
            }
          ],
          "encoding": {
            "x": {
              "field": "measure_value",
              "type": "quantitative",
              "stack": null,
              "title": "Value",
              "axis": { "orient": "bottom" }
            },
            "color": {
              "scale": {
                "domain": ["Target", "Pace", "Current"],
                "range": ["#000000", "#bcbcbc", "#A66BBF"]
              }
            },
            "order": {
              "field": "measure_order",
              "type": "quantitative",
              "sort": "descending"
            }
          }
        }
      ],
      "encoding": {
        "y": {
          "field": "categoryField",
          "type": "ordinal",
          "title": "Category",
          "axis": { "labelOverlap": true }
        },
        "tooltip": [
          { "field": "categoryField", "type": "nominal", "title": "Category" },
          { "field": "currentField", "type": "quantitative", "title": "Current" },
          { "field": "paceField", "type": "quantitative", "title": "Pace" },
          { "field": "targetField", "type": "quantitative", "title": "Target" }
        ]
      }
    }
  ]
}
Medidor
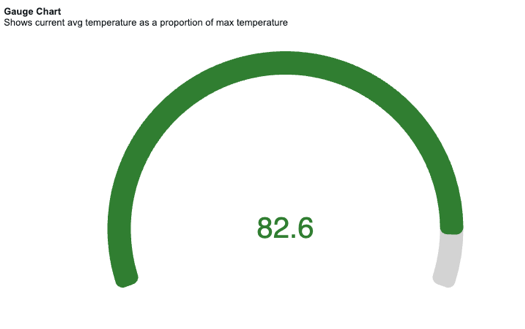
Defina $valueField e $totalField na seção Campos .
especificação JSON
{
  "$schema": "https://vega.github.io/schema/vega-lite/v6.json",
  "width": "container",
  "height": "container",
  "data": { "name": "databricks_query" },
  "config": {
    "concat": { "spacing": 0 },
    "autosize": { "type": "fit", "contains": "padding" }
  },
  "params": [
    { "name": "ring_max", "expr": "min(width, height) / 2 - 16" },
    { "name": "ring_width", "expr": "max(12, (min(width, height) / 2) * 0.12)" },
    { "name": "ring_gap", "expr": "max(4, (min(width, height) / 2) * 0.03)" },
    { "name": "label_color", "value": "#000000" },
    { "name": "ring_background_opacity", "value": 0.3 },
    { "name": "ring0_percent", "value": 100 },
    { "name": "ring0_outer", "expr": "ring_max + 2" },
    { "name": "ring0_inner", "expr": "ring_max + 1" },
    { "name": "ring1_outer", "expr": "ring0_inner - ring_gap" },
    { "name": "ring1_inner", "expr": "ring1_outer - ring_width" },
    { "name": "ring1_middle", "expr": "(ring1_outer + ring1_inner) / 2" },
    { "name": "arc_size", "expr": "220" }
  ],
  "transform": [
    { "as": "ratio", "calculate": "datum['$valueField'] / datum['$totalField']" },
    { "as": "_arc_start_degrees", "calculate": "360 - ( arc_size / 2 )" },
    { "as": "_arc_end_degrees", "calculate": "0 + ( arc_size / 2 )" },
    { "as": "_arc_start_radians", "calculate": "2 * 3.14 * ( datum['_arc_start_degrees'] - 360 ) / 360" },
    { "as": "_arc_end_radians", "calculate": "2 * 3.14 * datum['_arc_end_degrees'] / 360" },
    { "as": "_arc_total_radians", "calculate": "datum['_arc_end_radians'] - datum['_arc_start_radians']" },
    { "as": "_ring_start_radians", "calculate": "datum['_arc_start_radians']" },
    {
      "as": "_ring_end_radians",
      "calculate": "datum['_arc_start_radians'] + ( datum['_arc_total_radians'] * datum['ratio'] )"
    }
  ],
  "layer": [
    {
      "mark": {
        "type": "arc",
        "color": "lightgrey",
        "theta": { "expr": "datum['_arc_start_radians']" },
        "radius": { "expr": "ring1_outer" },
        "theta2": { "expr": "datum['_arc_end_radians']" },
        "radius2": { "expr": "ring1_inner" },
        "cornerRadius": 10
      }
    },
    {
      "name": "RING",
      "mark": {
        "type": "arc",
        "theta": { "expr": "datum['_ring_start_radians']" },
        "radius": { "expr": "ring1_outer" },
        "theta2": { "expr": "datum['_ring_end_radians']" },
        "radius2": { "expr": "ring1_inner" },
        "cornerRadius": 10
      },
      "encoding": {
        "color": {
          "value": "#307E31",
          "condition": [
            { "test": "datum['ratio'] < 0.33", "value": "#880808" },
            { "test": "datum['ratio'] < 0.66", "value": "#E49B0F" }
          ]
        }
      }
    },
    {
      "mark": { "type": "text", "fontSize": 40 },
      "encoding": {
        "text": { "field": "$valueField" },
        "color": {
          "value": "#307E31",
          "condition": [
            { "test": "datum['ratio'] < 0.33", "value": "#880808" },
            { "test": "datum['ratio'] < 0.66", "value": "#E49B0F" }
          ]
        }
      }
    }
  ]
}
Gráfico de radar
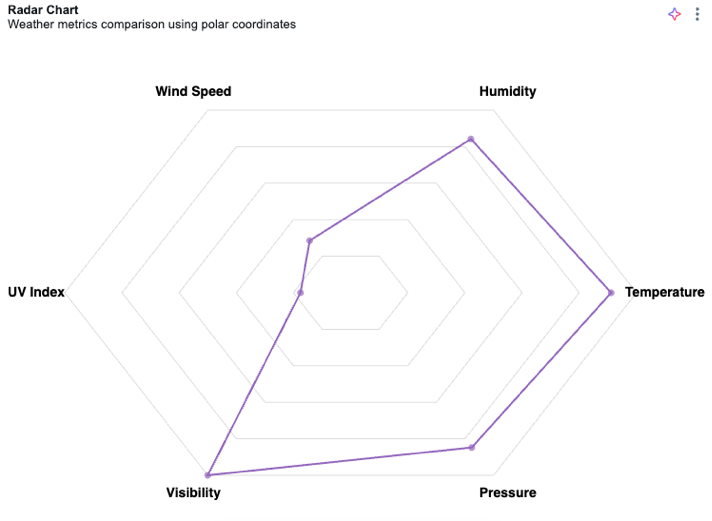
Defina $key e $value na seção Campos .
especificação JSON
{
  "$schema": "https://vega.github.io/schema/vega-lite/v5.json",
  "width": "container",
  "height": "container",
  "config": {
    "autosize": { "type": "fit", "contains": "padding" }
  },
  "data": { "name": "databricks_query" },
  "transform": [
    { "window": [{ "op": "row_number", "as": "category" }] },
    { "calculate": "datum.category - 1", "as": "category" },
    {
      "joinaggregate": [
        { "op": "count", "as": "numCategories" },
        { "op": "max", "field": "$value", "as": "maxValue" }
      ]
    },
    { "calculate": "2 * PI * datum.category / datum.numCategories", "as": "angle" },
    { "calculate": "100 * datum['$value'] / datum.maxValue", "as": "r" },
    { "calculate": "datum.r * cos(datum.angle)", "as": "x" },
    { "calculate": "datum.r * sin(datum.angle)", "as": "y" },
    { "calculate": "110 * cos(datum.angle)", "as": "label_x" },
    { "calculate": "110 * sin(datum.angle)", "as": "label_y" }
  ],
  "layer": [
    {
      "transform": [
        { "joinaggregate": [{ "op": "count", "as": "numCategories" }] },
        { "aggregate": [{ "op": "max", "field": "numCategories", "as": "numCategories" }] },
        { "calculate": "[0,1,2,3,4,5,6,7,8,9,10,11,12,13,14,15,16,17,18,19,20]", "as": "cats" },
        { "flatten": ["cats"], "as": ["cat"] },
        { "filter": "datum.cat <= datum.numCategories" },
        { "calculate": "2 * PI * datum.cat / datum.numCategories", "as": "angle" },
        { "calculate": "100 * cos(datum.angle)", "as": "x" },
        { "calculate": "100 * sin(datum.angle)", "as": "y" }
      ],
      "mark": { "type": "line", "color": "#ddd", "strokeWidth": 1 },
      "encoding": {
        "x": { "field": "x", "type": "quantitative", "scale": { "domain": [-120, 120] }, "axis": null },
        "y": { "field": "y", "type": "quantitative", "scale": { "domain": [-120, 120] }, "axis": null },
        "order": { "field": "cat" }
      }
    },
    {
      "transform": [
        { "joinaggregate": [{ "op": "count", "as": "numCategories" }] },
        { "aggregate": [{ "op": "max", "field": "numCategories", "as": "numCategories" }] },
        { "calculate": "[20,40,60,80,100]", "as": "levels" },
        { "flatten": ["levels"], "as": ["level"] },
        { "calculate": "[0,1,2,3,4,5,6,7,8,9,10,11,12,13,14,15,16,17,18,19,20]", "as": "cats" },
        { "flatten": ["cats"], "as": ["cat"] },
        { "filter": "datum.cat <= datum.numCategories" },
        { "calculate": "2 * PI * datum.cat / datum.numCategories", "as": "angle" },
        { "calculate": "datum.level", "as": "r" },
        { "calculate": "datum.r * cos(datum.angle)", "as": "x" },
        { "calculate": "datum.r * sin(datum.angle)", "as": "y" }
      ],
      "mark": { "type": "line", "color": "#ddd", "strokeWidth": 1 },
      "encoding": {
        "x": { "field": "x", "type": "quantitative" },
        "y": { "field": "y", "type": "quantitative" },
        "detail": { "field": "level" },
        "order": { "field": "cat" }
      }
    },
    {
      "mark": { "type": "line", "color": "#9467bd", "strokeWidth": 2, "interpolate": "linear-closed" },
      "encoding": {
        "x": { "field": "x", "type": "quantitative" },
        "y": { "field": "y", "type": "quantitative" },
        "order": { "field": "category" }
      }
    },
    {
      "mark": { "type": "point", "filled": true, "size": 50, "color": "#9467bd" },
      "encoding": {
        "x": { "field": "x", "type": "quantitative" },
        "y": { "field": "y", "type": "quantitative" }
      }
    },
    {
      "mark": { "type": "text", "fontSize": 14, "fontWeight": "bold" },
      "encoding": {
        "x": { "field": "label_x", "type": "quantitative" },
        "y": { "field": "label_y", "type": "quantitative" },
        "text": { "field": "$key", "type": "nominal" }
      }
    }
  ],
  "view": { "stroke": null }
}
Gráfico radial
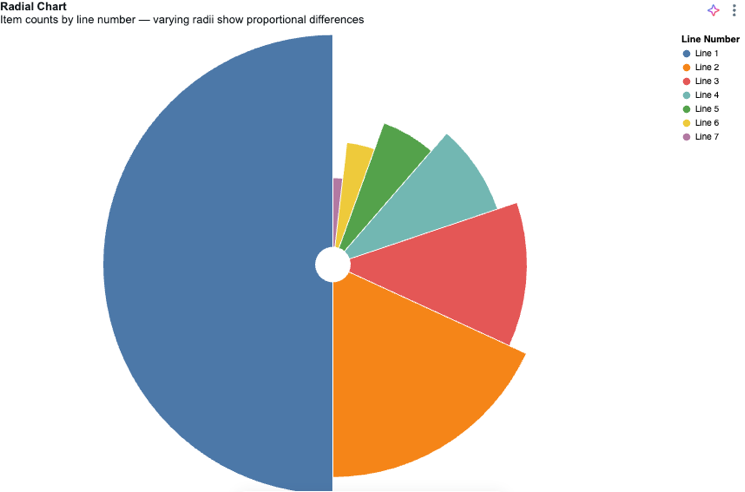
Defina $valueField e $colorField na seção Campos .
especificação JSON
{
  "$schema": "https://vega.github.io/schema/vega-lite/v6.json",
  "width": "container",
  "height": "container",
  "config": {
    "autosize": { "type": "fit", "contains": "padding" }
  },
  "data": { "name": "databricks_query" },
  "transform": [
    {
      "aggregate": [{ "op": "sum", "field": "$valueField", "as": "total" }],
      "groupby": ["$colorField"]
    },
    {
      "window": [{ "op": "rank", "as": "rank" }],
      "sort": [{ "field": "total", "order": "descending" }]
    }
  ],
  "layer": [
    {
      "mark": { "type": "arc", "innerRadius": 20, "stroke": "#fff" }
    }
  ],
  "encoding": {
    "theta": {
      "field": "total",
      "type": "quantitative",
      "scale": { "type": "sqrt" },
      "stack": true,
      "sort": "descending"
    },
    "radius": { "field": "total", "scale": { "type": "sqrt", "zero": true } },
    "color": {
      "field": "$colorField",
      "type": "nominal",
      "title": "Sub-Category",
      "sort": { "field": "total", "order": "descending" },
      "legend": { "orient": "right" }
    },
    "tooltip": [
      { "field": "$colorField", "type": "nominal", "title": "Sub-Category" },
      { "field": "total", "type": "quantitative", "title": "Sales" }
    ]
  },
  "view": { "stroke": null }
}
Gráfico sunburst
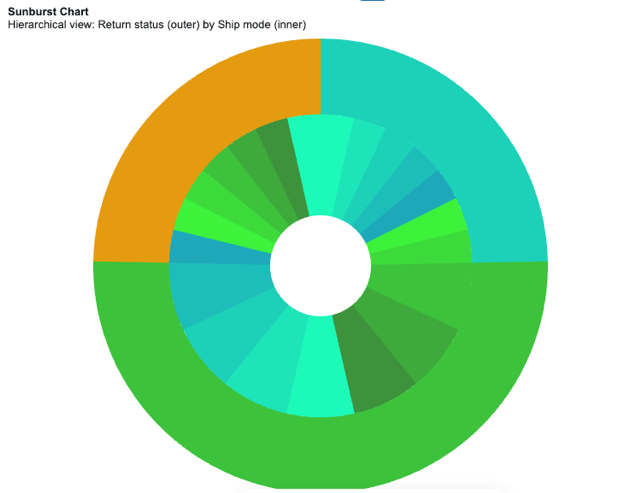
Defina,outerGroupField innerGroupFielde sizeField na seção **Campos**.
especificação JSON
{
  "$schema": "https://vega.github.io/schema/vega-lite/v5.json",
  "width": "container",
  "height": "container",
  "data": { "name": "databricks_query" },
  "config": {
    "autosize": { "type": "fit", "contains": "padding" }
  },
  "transform": [
    { "calculate": "datum['outerGroupField']", "as": "OUTSIDE" },
    { "calculate": "datum['innerGroupField']", "as": "INSIDE" },
    { "calculate": "datum.OUTSIDE + '-' + datum.INSIDE", "as": "OUT_IN" },
    { "calculate": "toNumber(datum['sizeField'])", "as": "SIZE" }
  ],
  "resolve": {
    "scale": { "color": "independent" },
    "legend": { "color": "independent" }
  },
  "layer": [
    {
      "mark": {
        "type": "arc",
        "tooltip": true,
        "innerRadius": { "expr": "min(width, height)/9" },
        "outerRadius": { "expr": "min(width, height)/3" }
      },
      "encoding": {
        "theta": { "field": "SIZE", "type": "quantitative", "stack": true },
        "color": {
          "field": "OUT_IN",
          "type": "ordinal",
          "sort": "ascending",
          "title": "Inner Grouping",
          "scale": {
            "range": [
              "#1DF9B9",
              "#1DE5B9",
              "#1DD1B9",
              "#1DBDB9",
              "#1DA9B9",
              "#3DF23B",
              "#3DDA3B",
              "#3DC23B",
              "#3DAA3B",
              "#3D923B"
            ]
          }
        },
        "order": { "field": "OUT_IN", "sort": "ascending" },
        "tooltip": [
          { "field": "OUTSIDE", "type": "nominal", "title": "Outer Grouping" },
          { "field": "INSIDE", "type": "nominal", "title": "Inner Grouping" },
          { "field": "SIZE", "type": "quantitative", "title": "Count" }
        ]
      }
    },
    {
      "transform": [
        {
          "aggregate": [{ "op": "sum", "field": "SIZE", "as": "total_users" }],
          "groupby": ["OUTSIDE"]
        }
      ],
      "mark": {
        "type": "arc",
        "tooltip": true,
        "innerRadius": { "expr": "min(width, height)/3" }
      },
      "encoding": {
        "theta": {
          "field": "total_users",
          "type": "quantitative",
          "stack": true,
          "sort": "ascending",
          "title": "Users Count"
        },
        "color": {
          "field": "OUTSIDE",
          "type": "ordinal",
          "sort": "ascending",
          "title": "Outer Grouping",
          "scale": { "range": ["#1DD1B9", "#3DC23B"] }
        },
        "order": { "field": "OUTSIDE", "sort": "ascending" },
        "tooltip": [
          { "field": "OUTSIDE", "type": "nominal", "title": "Outer Grouping" },
          { "field": "total_users", "type": "quantitative", "title": "Count" }
        ]
      }
    }
  ]
}
Limitações
- Gráficos de treemap não são compatíveis. Vega-Lite não oferece suporte a mapas de árvore.
- Marcas de imagem suportam apenas URLs de imagem base64
data:embutidas (por exemplo,data:image/png;base64,...) de 37 KB ou menos, nos formatos PNG, JPEG ou WebP. URLs de imagem remota (https:ouhttp:), URLs relativas, imagens SVG e URLs de imagem controladas por campo ou expressão não são compatíveis.