Manage classic compute
This article describes how to manage Databricks compute, including displaying, editing, starting, terminating, deleting, controlling access, and monitoring performance and logs. You can also use the Clusters API to manage compute programmatically.
View compute
To view your compute, click ![]() Compute in the workspace sidebar.
Compute in the workspace sidebar.
On the left side are two columns indicating if the compute has been pinned and the status of the compute. Hover over the status to get more information.
View compute configuration as a JSON file
Sometimes it can be helpful to view your compute configuration as JSON. This is especially useful when you want to create similar compute using the Clusters API. When you view an existing compute, go to the Configuration tab, click JSON in the top right of the tab, copy the JSON, and paste it into your API call. JSON view is read-only.
Pin a compute
30 days after a compute is terminated, it is permanently deleted. To keep an all-purpose compute configuration after a compute has been terminated for more than 30 days, an administrator can pin the compute. Up to 100 compute resources can be pinned.
Admins can pin a compute from the compute list or the compute detail page by clicking the pin icon.
Edit a compute
You can edit a compute's configuration from the compute details UI.
- Notebooks and jobs that were attached to the compute remain attached after editing.
- Libraries installed on the compute remain installed after editing.
- If you edit any attribute of a running compute (except for the compute size and permissions), you must restart it. This can disrupt users who are currently using the compute.
- You can only edit a running or terminated compute. You can, however, update permissions for compute not in those states on the compute details page.
Clone a compute
To clone an existing compute, select Clone from the compute's ![]() kebab menu.
kebab menu.
After you select Clone, the compute creation UI opens pre-populated with the compute configuration. The following attributes are NOT included in the clone:
- Compute permissions
- Attached notebooks
If you don't want to include the previously installed libraries in the cloned compute, click the drop-down menu next to the Create compute button and select Create without libraries.
Compute permissions
There are four permission levels for a compute: NO PERMISSIONS, CAN ATTACH TO, CAN RESTART, and CAN MANAGE. For details, see Compute ACLs.
Secrets are not redacted from the classic compute resource's Spark driver's stdout and stderr streams. To protect sensitive data, by default, Spark driver logs are viewable only by users with CAN MANAGE permission on job compute and all-purpose compute on dedicated or standard access mode. The same default applies to compute resources created from a pool. To allow users with CAN ATTACH TO or CAN RESTART permission to view the logs, set the following property in the compute's Spark config field: spark.databricks.acl.needAdminPermissionToViewLogs false.
On legacy compute with No isolation shared access mode, the Spark driver logs can be viewed by users with CAN ATTACH TO, CAN RESTART, or CAN MANAGE permission. To limit who can read the logs to only users with the CAN MANAGE permission, set spark.databricks.acl.needAdminPermissionToViewLogs to true.
Because spark.databricks.acl.needAdminPermissionToViewLogs is a compute-level Spark property, you must set it on each compute that needs it. For ephemeral job runs submitted via jobs/runs/submit, such as those triggered by an external orchestrator, set the property in new_cluster.spark_conf at submission time, along with any access_control_list entries.
Configure compute permissions
This section describes how to manage permissions using the workspace UI. You can also use the Permissions API or Databricks Terraform provider.
You must have the CAN MANAGE permission on a compute to configure compute permissions.
- In the sidebar, click Compute.
- On the row for the compute, click the kebab menu
 on the right, and select Edit permissions.
 - In Permission Settings, click the Select user, group or service principal… drop-down menu and select a user, group, or service principal.
- Select a permission from the permission drop-down menu.
- Click Add and click Save.
Terminate a compute
To save compute resources, you can terminate a compute. The terminated compute's configuration is stored so that it can be reused (or, in the case of jobs, autostarted) at a later time. You can manually terminate a compute or configure the compute to terminate automatically after a specified period of inactivity.
Unless a compute is pinned or restarted, it is automatically and permanently deleted 30 days after termination. Because this deletion is performed by the system rather than a user or API action, it doesn't appear in audit logs.
Terminated compute appear in the compute list with a gray circle at the left of the compute name.
When you run a job on a new Job compute (which is usually recommended), the compute terminates and is unavailable for restarting when the job is complete. On the other hand, if you schedule a job to run on an existing All-Purpose compute that has been terminated, that compute will autostart.
Manual termination
You can manually terminate a compute from the compute list (by clicking the square on the compute's row) or the compute detail page (by clicking Terminate).
Automatic termination
You can also set auto termination for a compute. During compute creation, you can specify an inactivity period in minutes after which you want the compute to terminate.
If the difference between the current time and the last command run on the compute is more than the inactivity period specified, Databricks automatically terminates that compute.
A compute is considered inactive when all commands on the compute, including Spark jobs, Structured Streaming, JDBC calls, and Databricks web terminal activity have finished executing. This does not include commands run by SSH-ing into the compute and running bash commands outside of the Databricks web terminal.
- Compute do not report activity resulting from the use of DStreams. This means that an auto-terminating compute may be terminated while it is running DStreams. Turn off auto termination for compute running DStreams or consider using Structured Streaming.
- Idle compute continue to accumulate DBU and cloud instance charges during the inactivity period before termination.
Configure automatic termination
You can configure automatic termination in the new compute UI. Ensure that the box is checked, and enter the number of minutes in the Terminate after ___ of minutes of inactivity setting.
You can opt out of auto termination by clearing the Auto Termination checkbox or by specifying an inactivity period of 0.
Auto termination is best supported in the latest Spark versions. Older Spark versions have known limitations which can result in inaccurate reporting of compute activity. For example, compute running JDBC, R, or streaming commands can report a stale activity time that leads to premature compute termination. Please upgrade to the most recent Spark version to benefit from bug fixes and improvements to auto termination.
Unexpected termination
Sometimes a compute is terminated unexpectedly, not as a result of a manual termination or a configured automatic termination.
For a list of termination reasons and remediation steps, see the Knowledge Base.
Delete a compute
Deleting a compute terminates the compute and removes its configuration. To delete a compute, select Delete from the compute's ![]() menu.
menu.
You cannot undo this action.
To delete a pinned compute, it must first be unpinned by an administrator.
You can also invoke the Clusters API endpoint to delete a compute programmatically.
Restart a compute
You can restart a previously terminated compute from the compute list, the compute detail page, or a notebook. You can also invoke the Clusters API endpoint to start a compute programmatically.
Databricks identifies a compute using its unique cluster ID. When you start a terminated compute, Databricks re-creates the compute with the same ID, automatically installs all the libraries, and reattaches the notebooks.
Restart a compute to update it with the latest images
When you restart a compute, it gets the latest images for the compute resource containers and the VM hosts. It is important to schedule regular restarts for long-running compute such as those used for processing streaming data.
It is your responsibility to restart all compute resources regularly to keep the image up-to-date with the latest image version.
If you enable the compliance security profile for your account or your workspace, long-running compute is automatically restarted as needed during a scheduled maintenance window. This reduces the risk of an auto-restart disrupting a scheduled job. You can also force a restart during the maintenance window. See Automatic cluster update.
Notebook example: Find long-running compute
If you are a workspace admin, you can run a script that determines how long each of your compute has been running, and optionally, restart them if they are older than a specified number of days. Databricks provides this script as a notebook.
If your workspace is part of the public preview of automatic compute update, you might not need this script. Compute restarts automatically if needed during the scheduled maintenance windows.
The first lines of the script define configuration parameters:
min_age_output: The maximum number of days that a compute can run. Default is 1.perform_restart: IfTrue, the script restarts any compute with age greater than the number of days specified bymin_age_output. The default isFalse, which identifies long-running compute but does not restart them.secret_configuration: ReplaceREPLACE_WITH_SCOPEandREPLACE_WITH_KEYwith a secret scope and key name. For more details of setting up the secrets, see the notebook.
If you set perform_restart to True, the script automatically restarts eligible compute, which can cause active jobs to fail and reset open notebooks. To reduce the risk of disrupting your workspace's business-critical jobs, plan a scheduled maintenance window and be sure to notify the workspace users.
Identify and optionally restart long-running compute
Compute autostart for jobs and JDBC/ODBC queries
When a job assigned to a terminated compute is scheduled to run, or you connect to a terminated compute from a JDBC/ODBC interface, the compute is automatically restarted. See Configure compute for jobs and JDBC connect.
Compute autostart allows you to configure compute to auto-terminate without requiring manual intervention to restart the compute for scheduled jobs. Furthermore, you can schedule compute initialization by scheduling a job to run on a terminated compute.
Before a compute is restarted automatically, compute and job access control permissions are checked.
If your compute was created in Databricks platform version 2.70 or earlier, there is no autostart: jobs scheduled to run on terminated compute will fail.
View compute information in the Spark UI
You can view detailed information about Spark jobs by selecting the Spark UI tab on the compute details page.
If you restart a terminated compute, the Spark UI displays information for the restarted compute, not the historical information for the terminated compute.
See Diagnose cost and performance issues using the Spark UI to walk through diagnosing cost and performance issues using the Spark UI.
View compute logs
Databricks provides three kinds of logging of compute-related activity:
- Compute event logs, which capture compute lifecycle events like creation, termination, and configuration edits.
- Apache Spark driver and worker log, which you can use for debugging.
- Compute init-script logs, which are valuable for debugging init scripts.
This section discusses compute event logs and driver and worker logs. For details about init-script logs, see Init script logging.
Compute event logs
The compute event log displays important compute lifecycle events that are triggered manually by user actions or automatically by Databricks. Such events affect the operation of a compute as a whole and the jobs running in the compute.
For supported event types, see the Clusters API data structure.
Events are stored for 60 days, which is comparable to other data retention times in Databricks.
View a compute's event log
To view the compute's event log, select the Event log tab on the compute details pages.
For more information about an event, click its row in the log, then click the JSON tab for details.
Compute driver and worker logs
The direct print and log statements from your notebooks, jobs, and libraries go to the Spark driver logs. You can access these log files from the Driver logs tab on the compute details page. Click the name of a log file to download it.
These logs have three outputs:
- Standard output
- Standard error
- Log4j logs
To view Spark worker logs, use the Spark UI tab. You can also configure a log delivery location for the compute. Both worker and compute logs are delivered to the location you specify.
Compute metrics
Compute metrics are available for classic all-purpose and jobs compute. To access the compute metrics UI, click the name of an individual compute resource in the compute list and then click the Metrics tab.
You can view historical metrics by selecting a time range using the date picker filter. Metrics are collected every minute. You can also get the latest metrics by clicking the Refresh button. For more information, see View compute metrics.
Notebook example: Datadog metrics
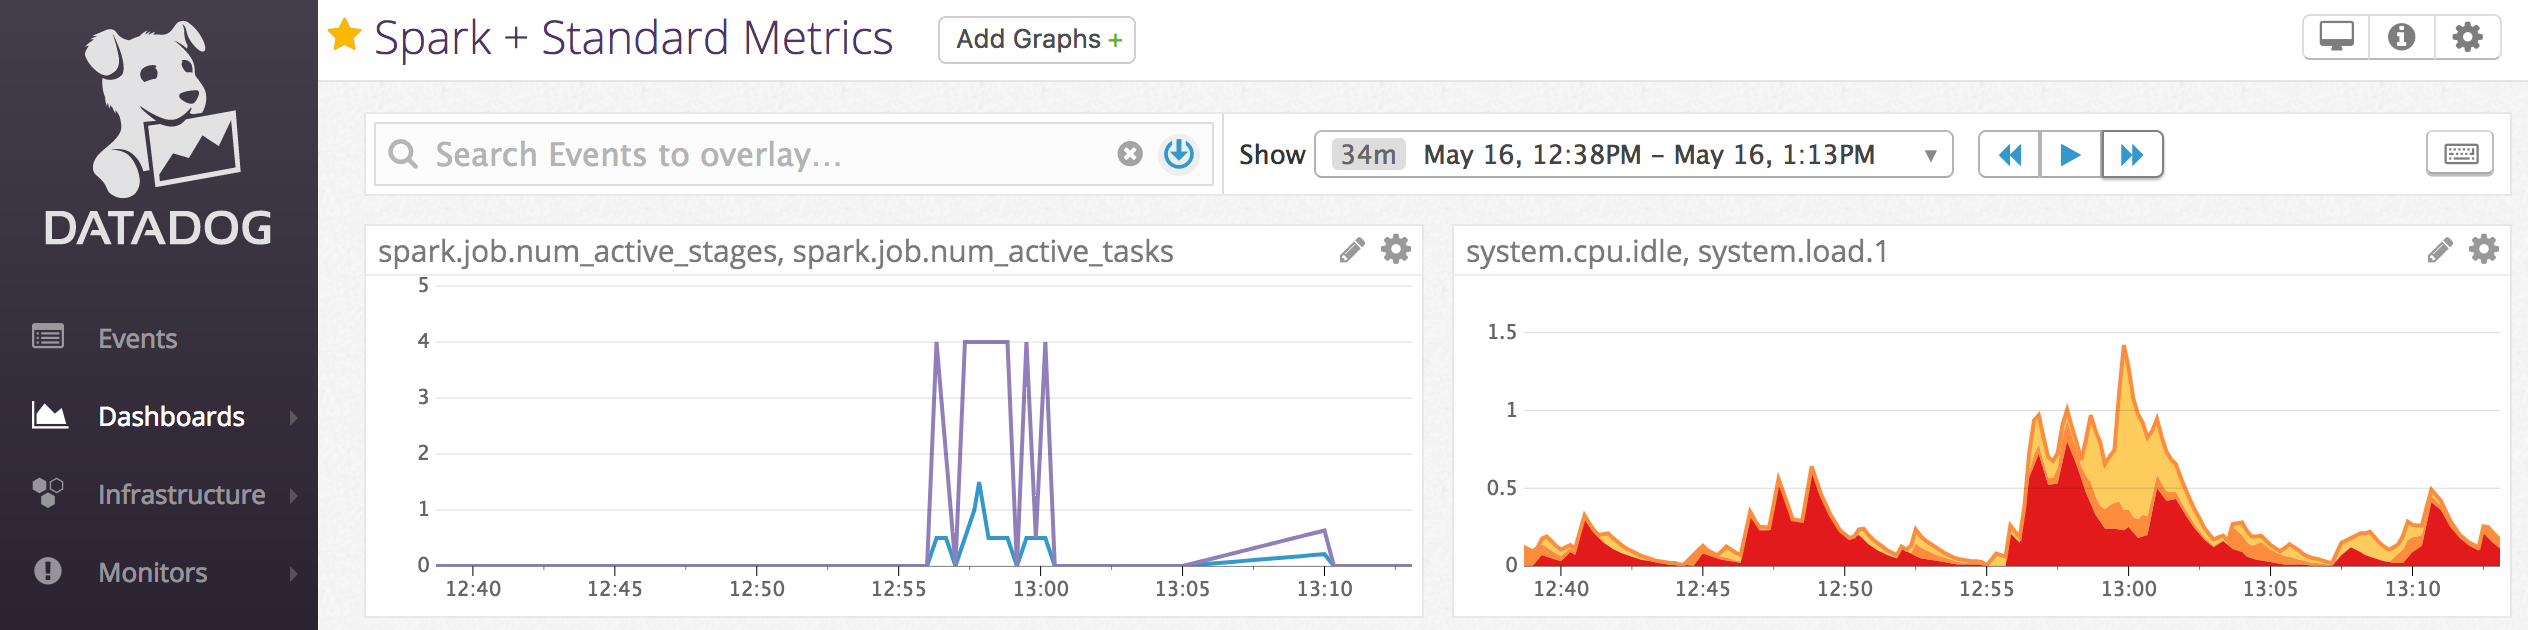
You can install Datadog agents on compute nodes to send Datadog metrics to your Datadog account. The following notebook demonstrates how to install a Datadog agent on a compute using a compute-scoped init script.
To install the Datadog agent on all compute, manage the compute-scoped init script using a compute policy.
Install Datadog agent init script notebook
Decommission spot instances
Because spot instances can reduce costs, creating compute using spot instances rather than on-demand instances is a common way to run jobs. However, spot instances can be preempted by cloud provider scheduling mechanisms. Preemption of spot instances can cause issues with jobs that are running, including:
- Shuffle fetch failures
- Shuffle data loss
- RDD data loss
- Job failures
You can enable decommissioning to help address these issues. Decommissioning takes advantage of the notification that the cloud provider usually sends before a spot instance is decommissioned. When a spot instance containing an executor receives a preemption notification, the decommissioning process will attempt to migrate shuffle and RDD data to healthy executors. The duration before the final preemption is typically 30 seconds to 2 minutes, depending on the cloud provider.
Databricks recommends enabling data migration when decommissioning is also enabled. Generally, the possibility of errors decreases as more data is migrated, including shuffle fetching failures, shuffle data loss, and RDD data loss. Data migration can also lead to less re-computation and saved costs.
Decommissioning is a best effort and does not guarantee that all data can be migrated before final preemption. Decommissioning cannot guarantee against shuffle fetch failures when running tasks are fetching shuffle data from the executor.
With decommissioning enabled, task failures caused by spot instance preemption are not added to the total number of failed attempts. Task failures caused by preemption are not counted as failed attempts because the cause of the failure is external to the task and will not result in job failure.
Enable decommissioning
To enable decommissioning on a compute, enter the following properties in the Spark tab under Advanced Options in the compute configuration UI. For information on these properties, see Spark configuration.
-
To enable decommissioning for applications, enter this property in the Spark config field:
spark.decommission.enabled true -
To enable shuffle data migration during decommissioning, enter this property in the Spark config field:
spark.storage.decommission.enabled true
spark.storage.decommission.shuffleBlocks.enabled true -
To enable RDD cache data migration during decommissioning, enter this property in the Spark config field:
spark.storage.decommission.enabled true
spark.storage.decommission.rddBlocks.enabled truenoteWhen RDD StorageLevel replication is set to more than 1, Databricks does not recommend enabling RDD data migration since the replicas ensure RDDs will not lose data.
-
To enable decommissioning for workers, enter this property in the Environment Variables field:
SPARK_WORKER_OPTS="-Dspark.decommission.enabled=true"
View the decommission status and loss reason in the UI
To access a worker's decommission status from the UI, navigate to the Spark compute UI - Master tab.
When the decommissioning finishes, you can view the executor's loss reason in the Spark UI > Executors tab on the compute details page.