View compute metrics
This article explains how to use the native compute metrics tool in the Databricks UI to gather key hardware and Spark metrics. The metrics UI is available for all-purpose and jobs compute.
Metrics are available in almost real-time with a normal delay of less than one minute. Metrics are stored in Databricks-managed storage, not in the customer's storage.
Serverless compute for notebooks and jobs uses query insights instead of the metrics UI. For more information on serverless compute metrics, see View query insights.
Access compute metrics UI
To view the compute metrics UI:
- Click Compute in the sidebar.
- Click on the compute resource you want to view metrics for.
- Click the Metrics tab.
Hardware metrics for all nodes are shown by default. To view Spark metrics, click the drop-down menu labeled Hardware and select Spark. You can also select GPU if the instance is GPU-enabled.
Filter metrics by time period
You can view historical metrics by selecting a time range using the date picker filter. Metrics are collected every minute, so you can filter by any range of day, hour, or minute from the last 30 days. Click the calendar icon to select from predefined data ranges, or click inside the text box to define custom values.
The time intervals displayed in the charts adjust based on the length of time you are viewing. Most metrics are averages based on the time interval you are currently viewing.
You can also get the latest metrics by clicking the Refresh button.
View metrics at the node level
By default, the metrics page shows you metrics for all nodes within a cluster (including the driver) averaged over the time period.
You can view metrics for individual nodes by clicking the All nodes drop-down menu and selecting the node you want to view metrics for. GPU metrics are only available at the individual-node level. Spark metrics are not available for individual nodes.
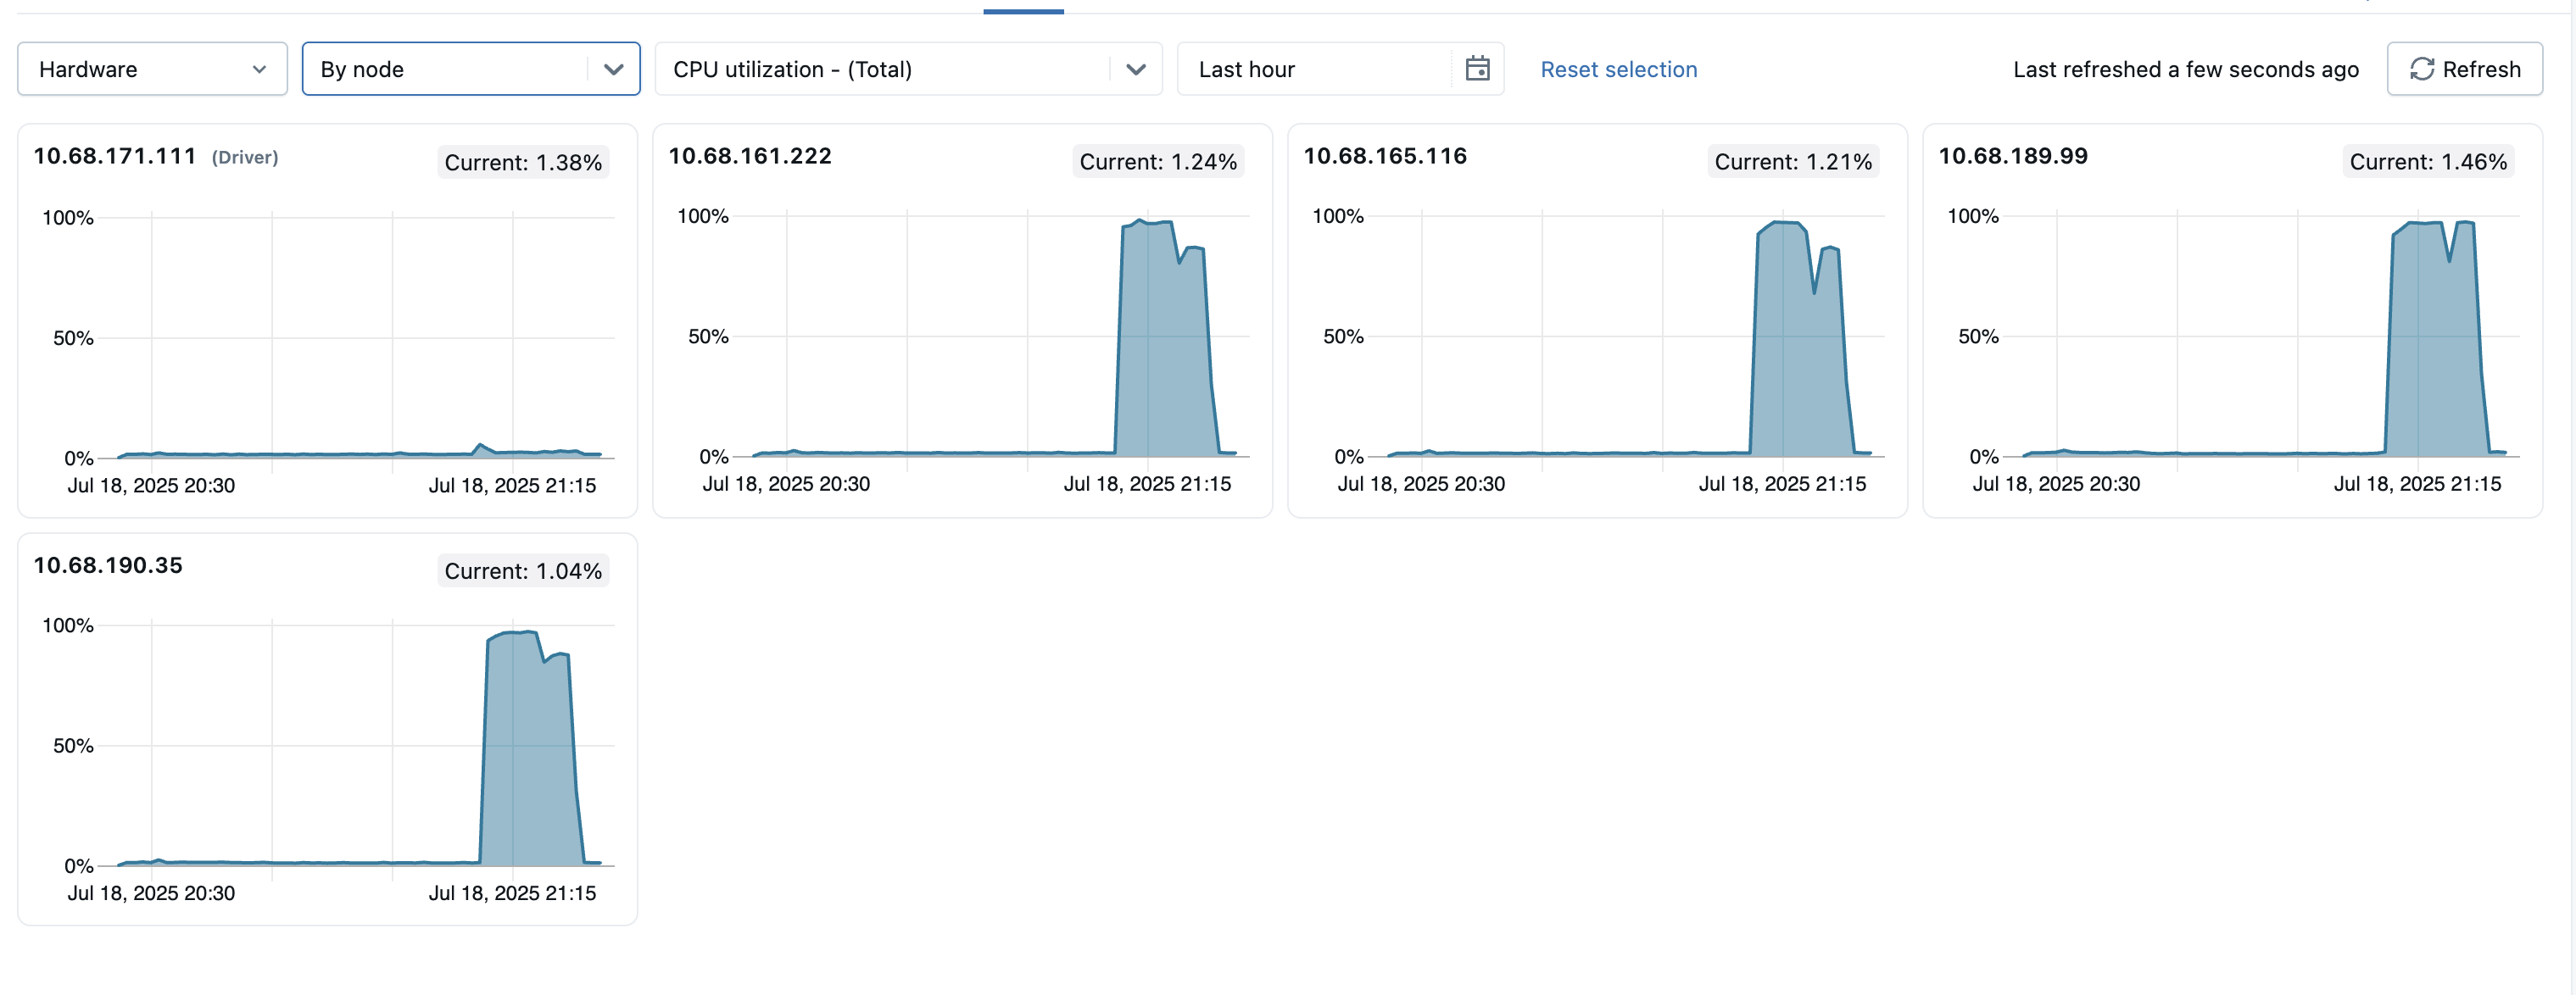
To help identify any outlier nodes within the cluster, you can also view metrics for all individual nodes on a single page. To access this view, click the All nodes dropdown menu and select By node, then select the metric subcategory you want to view.
Hardware metric charts
The following hardware metric charts are available to view in the compute metrics UI:
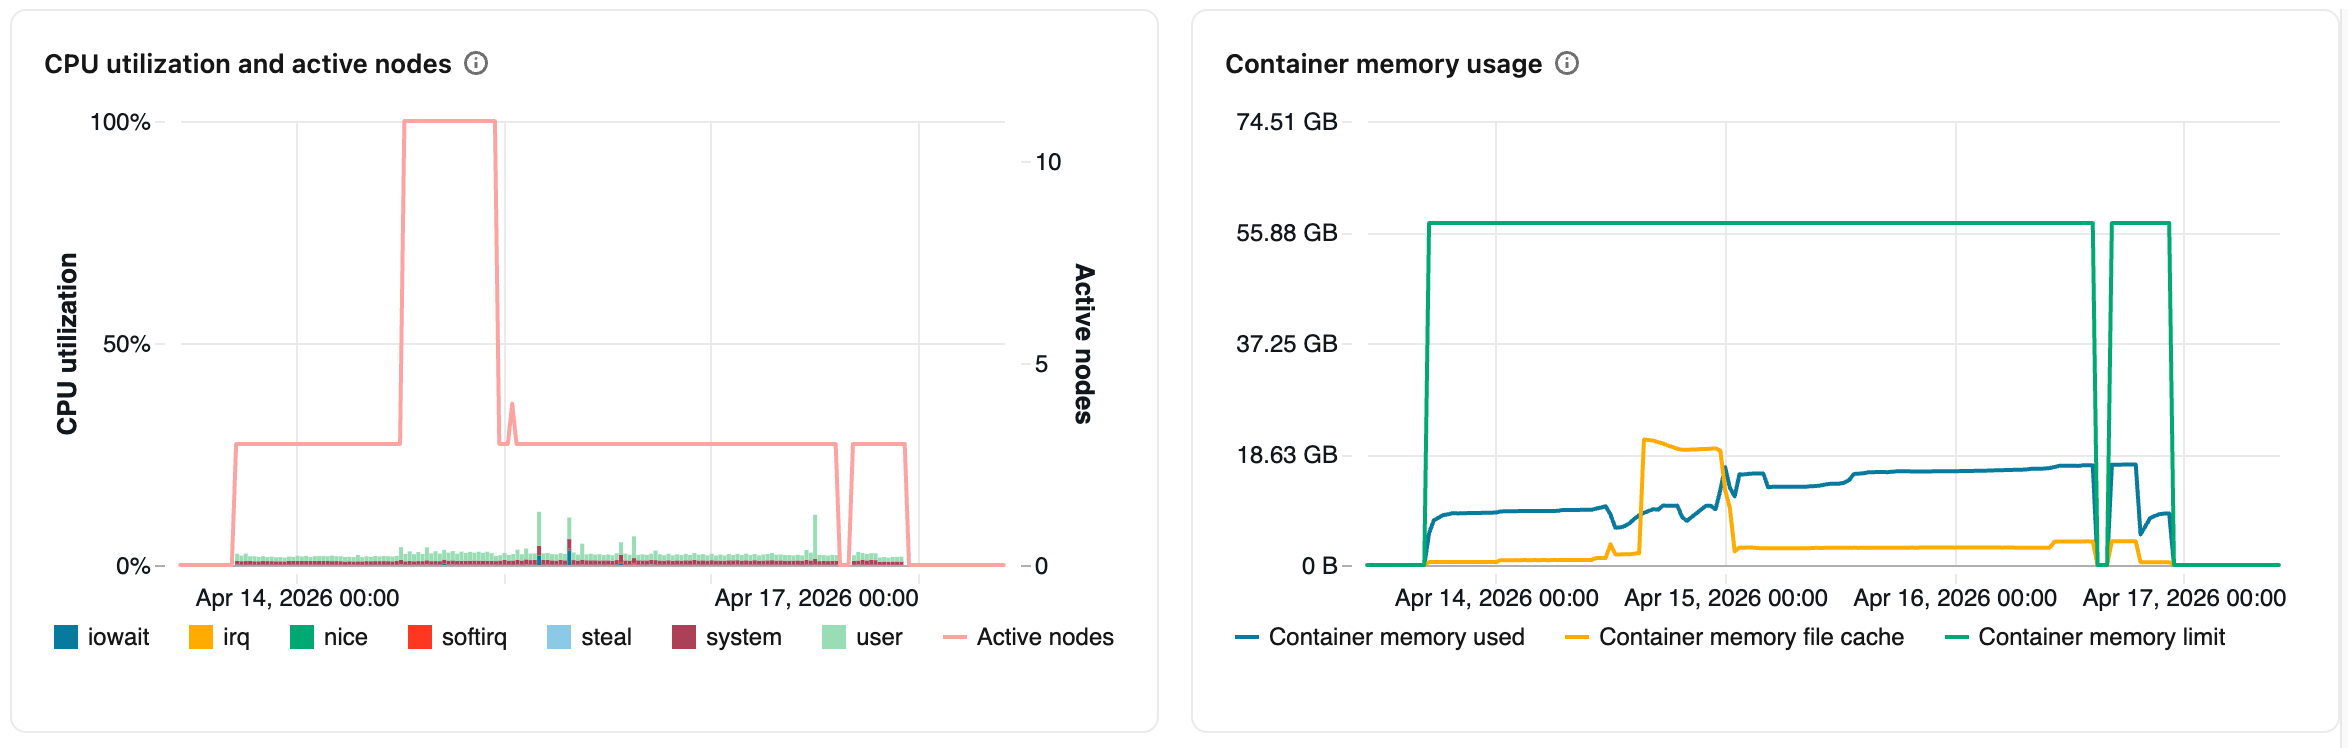
- CPU utilization and active nodes: The line graph displays the number of active nodes at every timestamp for the given compute. The bar graph displays the percentage of time the CPU spent in each mode, based on total CPU seconds cost. The following are the tracked modes:
guest: If you are running VMs, the CPU those VMs useiowait: Time spent waiting for I/Oidle: Time the CPU had nothing to doirq: Time spent on interrupt requestsnice: Time used by processes that have a positive niceness, meaning a lower priority than other taskssoftirq: Time spent on software interrupt requestssteal: If you are a VM, time other VMs “stole” from your CPUssystem: The time spent in the kerneluser: The time spent in userland
- Container memory usage: The memory consumed by the Spark container, averaged across all applicable nodes. Includes averages of non-reclaimable memory (
Container memory used), the OS file page cache (Container memory file cache), and the configured memory limit (Container memory limit). - JVM heap usage: The JVM heap memory usage, averaged across all applicable nodes. Includes averages of the actual heap usage, the heap capacity, and the configured maximum heap limit.
- Network received and transmitted: The number of bytes received and transmitted through the network by each device.
- Free filesystem space: The total filesystem usage by each mount point, measured in bytes.
Click Node memory usage at the bottom of the Hardware tab to expand the following additional chart:
- Memory utilization and swap: The line graph shows the total memory swap usage by mode, measured in bytes. The bar graph shows the total memory usage by mode, also measured in bytes. The following usage types are tracked:
used: Total OS-level memory in use, including memory used by background processes running on a compute. Because the driver and background processes utilize memory, usage can still appear even when no Spark jobs are running.other: Memory in use for purposes other thanused,buffer, orcachedbuffer: Memory used by kernel bufferscached: Memory used by the file system cache on the OS levelfree: Unused memory. Anything not attributed to one of the above categories in the chart is free.
Spark metrics charts
The following Spark metric charts are available to view in the compute metrics UI:
- Server load distribution: These tiles show the CPU utilization over the past minute for each node in the compute resource. Each tile is a clickable link to the individual node's metrics page.
- Active tasks: The total number of tasks executing at any given time.
- Total failed tasks: The total number of tasks that have failed in executors.
- Total completed tasks: The total number of tasks that have completed in executors.
- Total number of tasks: The total number of all tasks (running, failed, and completed) in executors.
- Total shuffle read: The total size of shuffle read data, measured in bytes.
Shuffle readmeans the sum of serialized read data on all executors at the beginning of a stage. - Total shuffle write: The total size of shuffle write data, measured in bytes.
Shuffle Writeis the sum of all written serialized data on all executors before transmitting (normally at the end of a stage). - Total task duration: The total elapsed time the JVM spent executing tasks on executors, measured in seconds.
GPU metric charts
GPU metrics are only available on Databricks Runtime ML 13.3 and above.
The following GPU metric charts are available to view in the compute metrics UI:
- Server load distribution: This chart shows the CPU utilization over the past minute for each node.
- Per-GPU decoder utilization: The percentage of GPU decoder utilization.
- Per-GPU encoder utilization: The percentage of GPU encoder utilization.
- Per-GPU frame buffer memory utilization bytes: The frame buffer memory utilization, measured in bytes.
- Per-GPU memory utilization: The percentage of GPU memory utilization.
- Per-GPU utilization: The percentage of GPU utilization.
Troubleshooting
If you see incomplete or missing metrics for a period, it could be one of the following issues:
- An outage in the Databricks service responsible for querying and storing metrics.
- Network issues on the customer's side.
- The compute is or was in an unhealthy state.