View table insights and popularity
You can use the Insights tab in Catalog Explorer to view usage trends and frequent queries, users, dashboards, notebooks, and joined tables for any table registered in Unity Catalog. The Insights tab includes a Table usage in the last 30 days graph and sections listing frequent activity for the past month. Catalog Explorer also shows the relative popularity of tables and columns based on recent query activity. See Popularity.
This information can help you answer questions like:
- Can I trust this data?
- What are some good ways to use this data?
- Which users can answer my questions about this data?
The queries listed on the Insights tab are limited to queries performed using Databricks SQL.
Before you begin
You must have the following permissions to view frequent queries and user data on the Insights tab.
In Unity Catalog:
SELECTprivilege on the table.USE SCHEMAprivilege on the table's parent schema.USE CATALOGprivilege on the table's parent catalog.
Metastore admins have these privileges by default. See Manage privileges in Unity Catalog.
In Databricks SQL:
- CAN VIEW permissions on the queries. You will not see queries that you do not have permission to view. See Query ACLs.
View the Insights tab
-
In your Databricks workspace, click
 Catalog to open Catalog Explorer.
 -
Search for or navigate to the table you want insights on.
See Search for workspace objects and Explore database objects.
-
On the table page, click the Insights tab.
The Table usage in the last 30 days graph and sections for frequent users, queries, dashboards, notebooks, and joined tables appear.
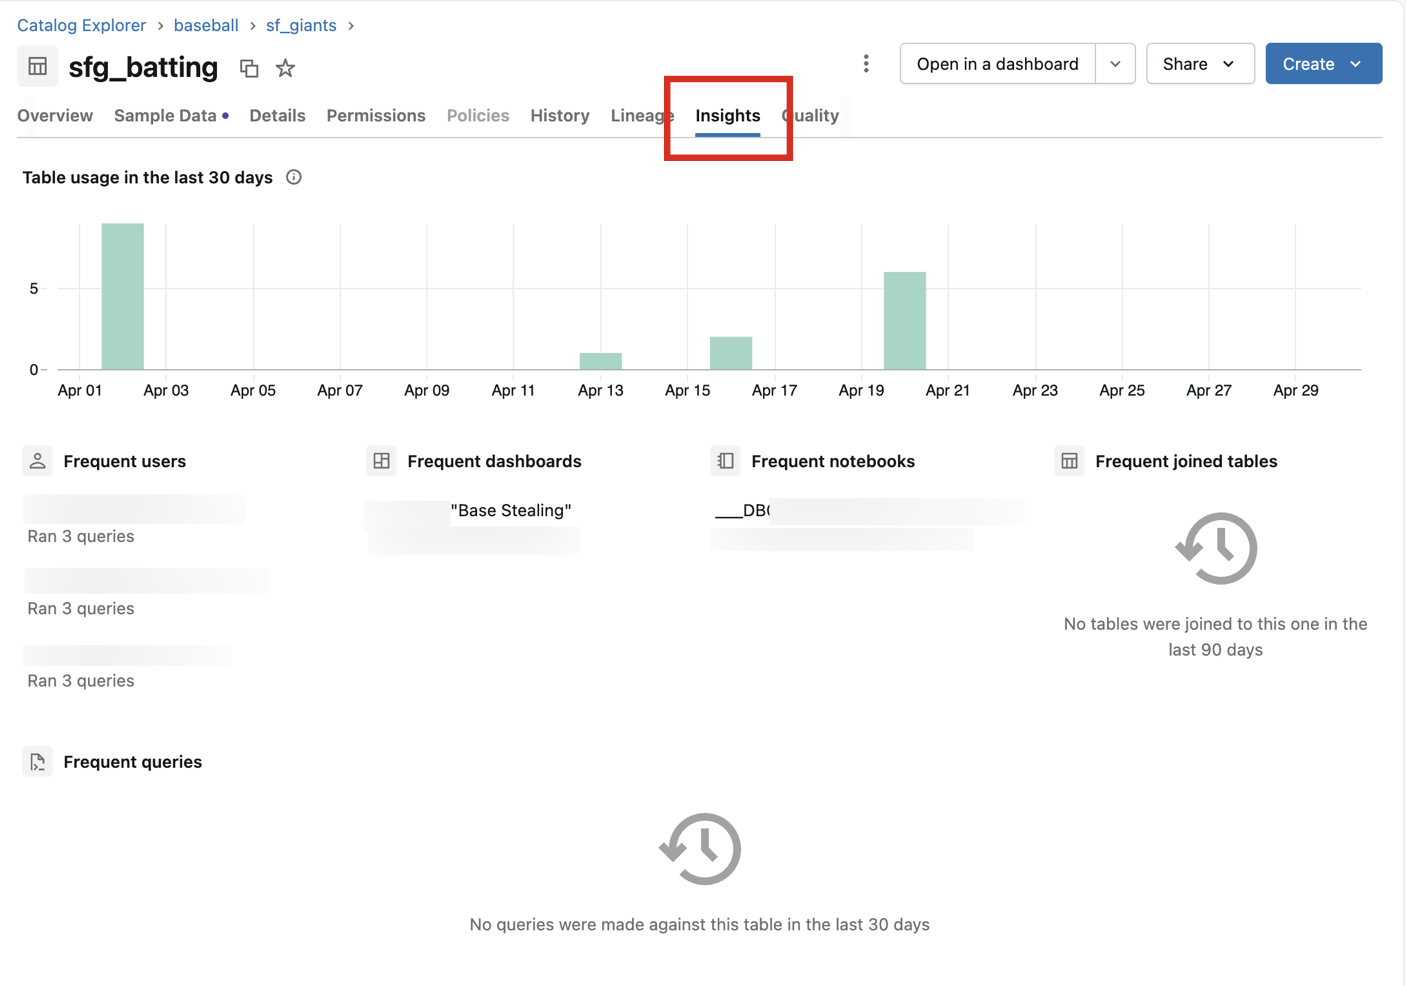
The Table usage in the last 30 days graph and Frequent joined tables section are metastore-scoped and show activity across all workspaces attached to the metastore. The Frequent users, Frequent queries, Frequent dashboards, and Frequent notebooks sections are workspace-scoped and show activity in the current workspace only. If the usage graph shows activity but the "Frequent" sections appear empty or incomplete, the queries likely originated from a different workspace. To query user activity across all workspaces programmatically, use the lineage system tables.
Popularity
Popularity reflects how frequently a table or its columns are queried over the last 30 days. Use these signals to identify the most-used data as you explore a schema or table.
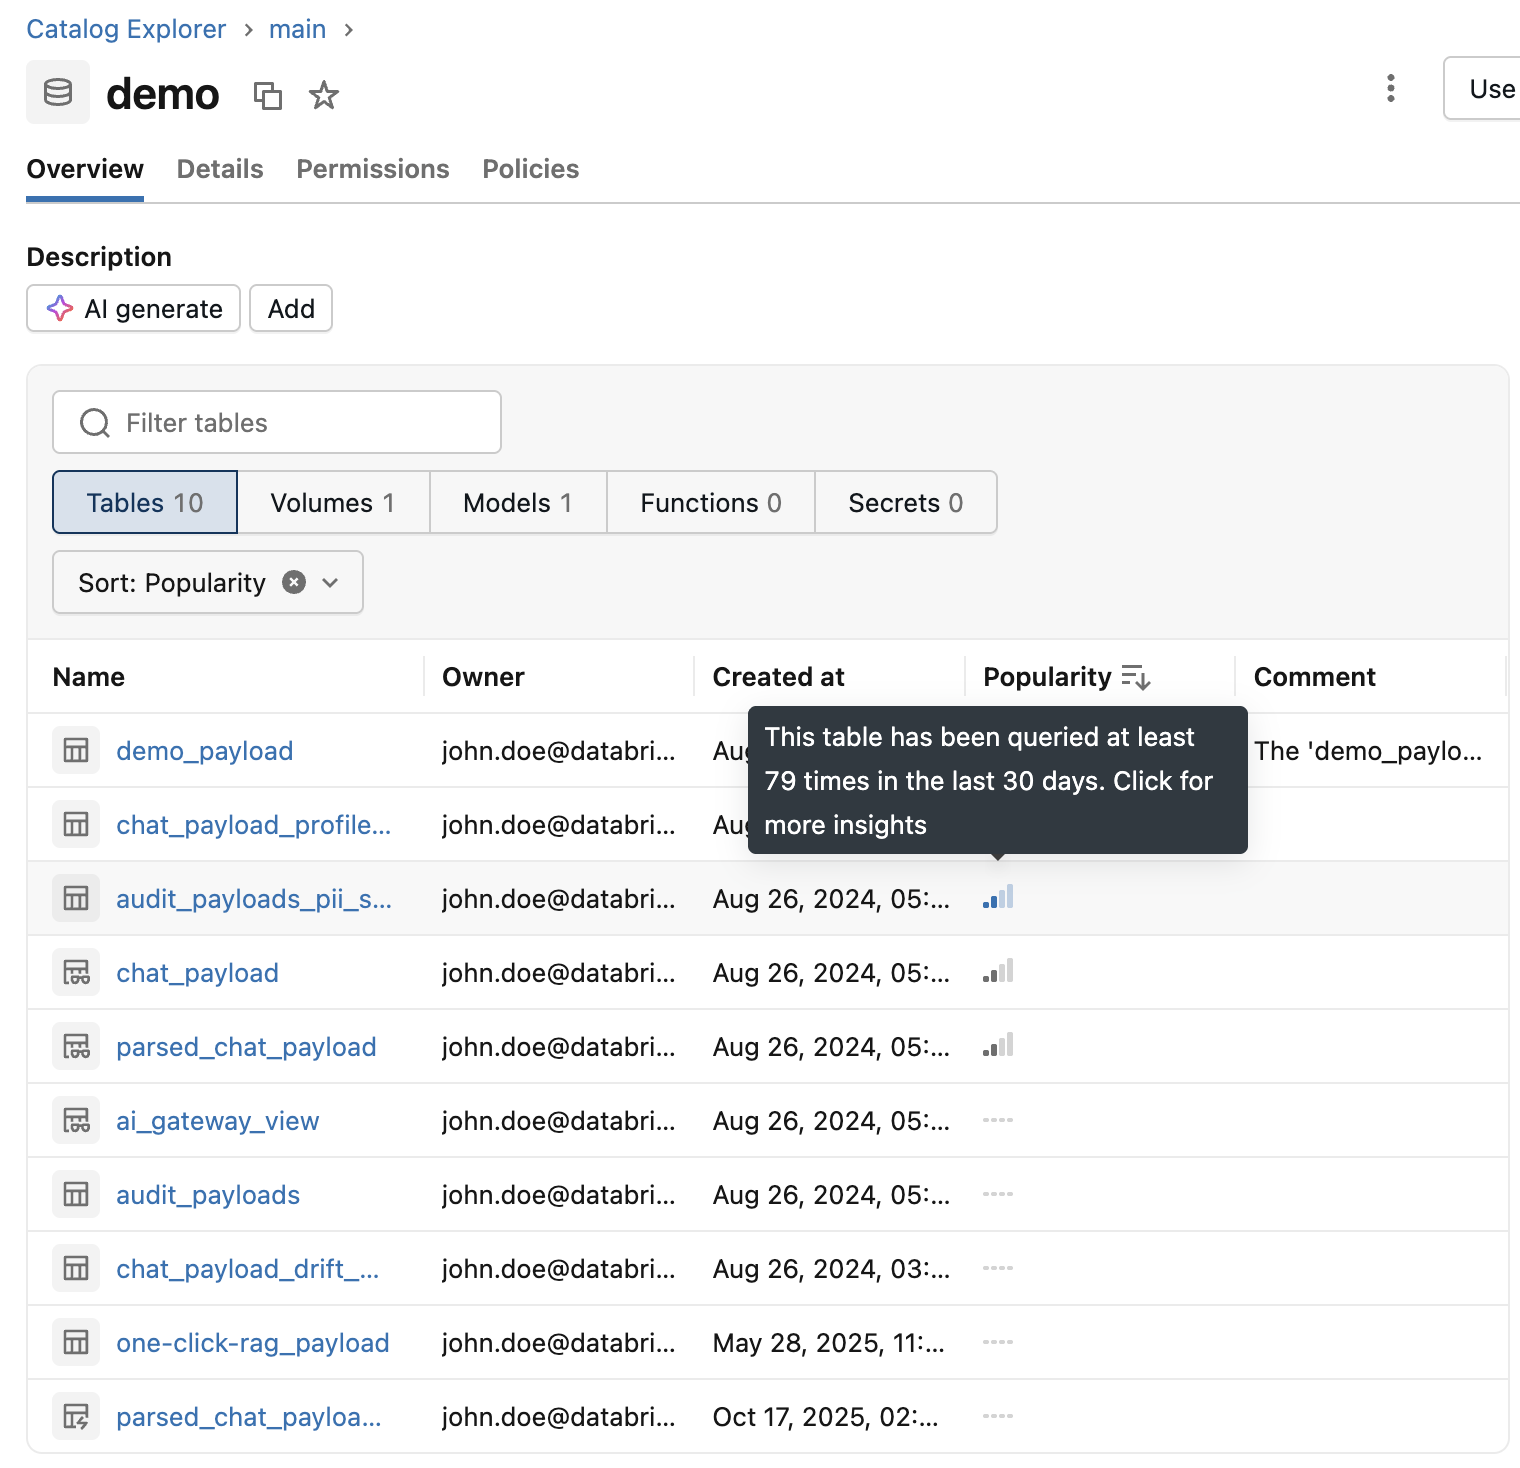
Table popularity: To find the most popular tables in a schema, open the schema's Overview tab and sort the tables by popularity. The popularity metric is determined by the total number of interactive reads of a table, including reads from JDBC, the SQL Statement Execution API, SQL connectors, and sample data clicks in Catalog Explorer. Hover over a table's popularity icon to see how many times it was queried in the last 30 days.
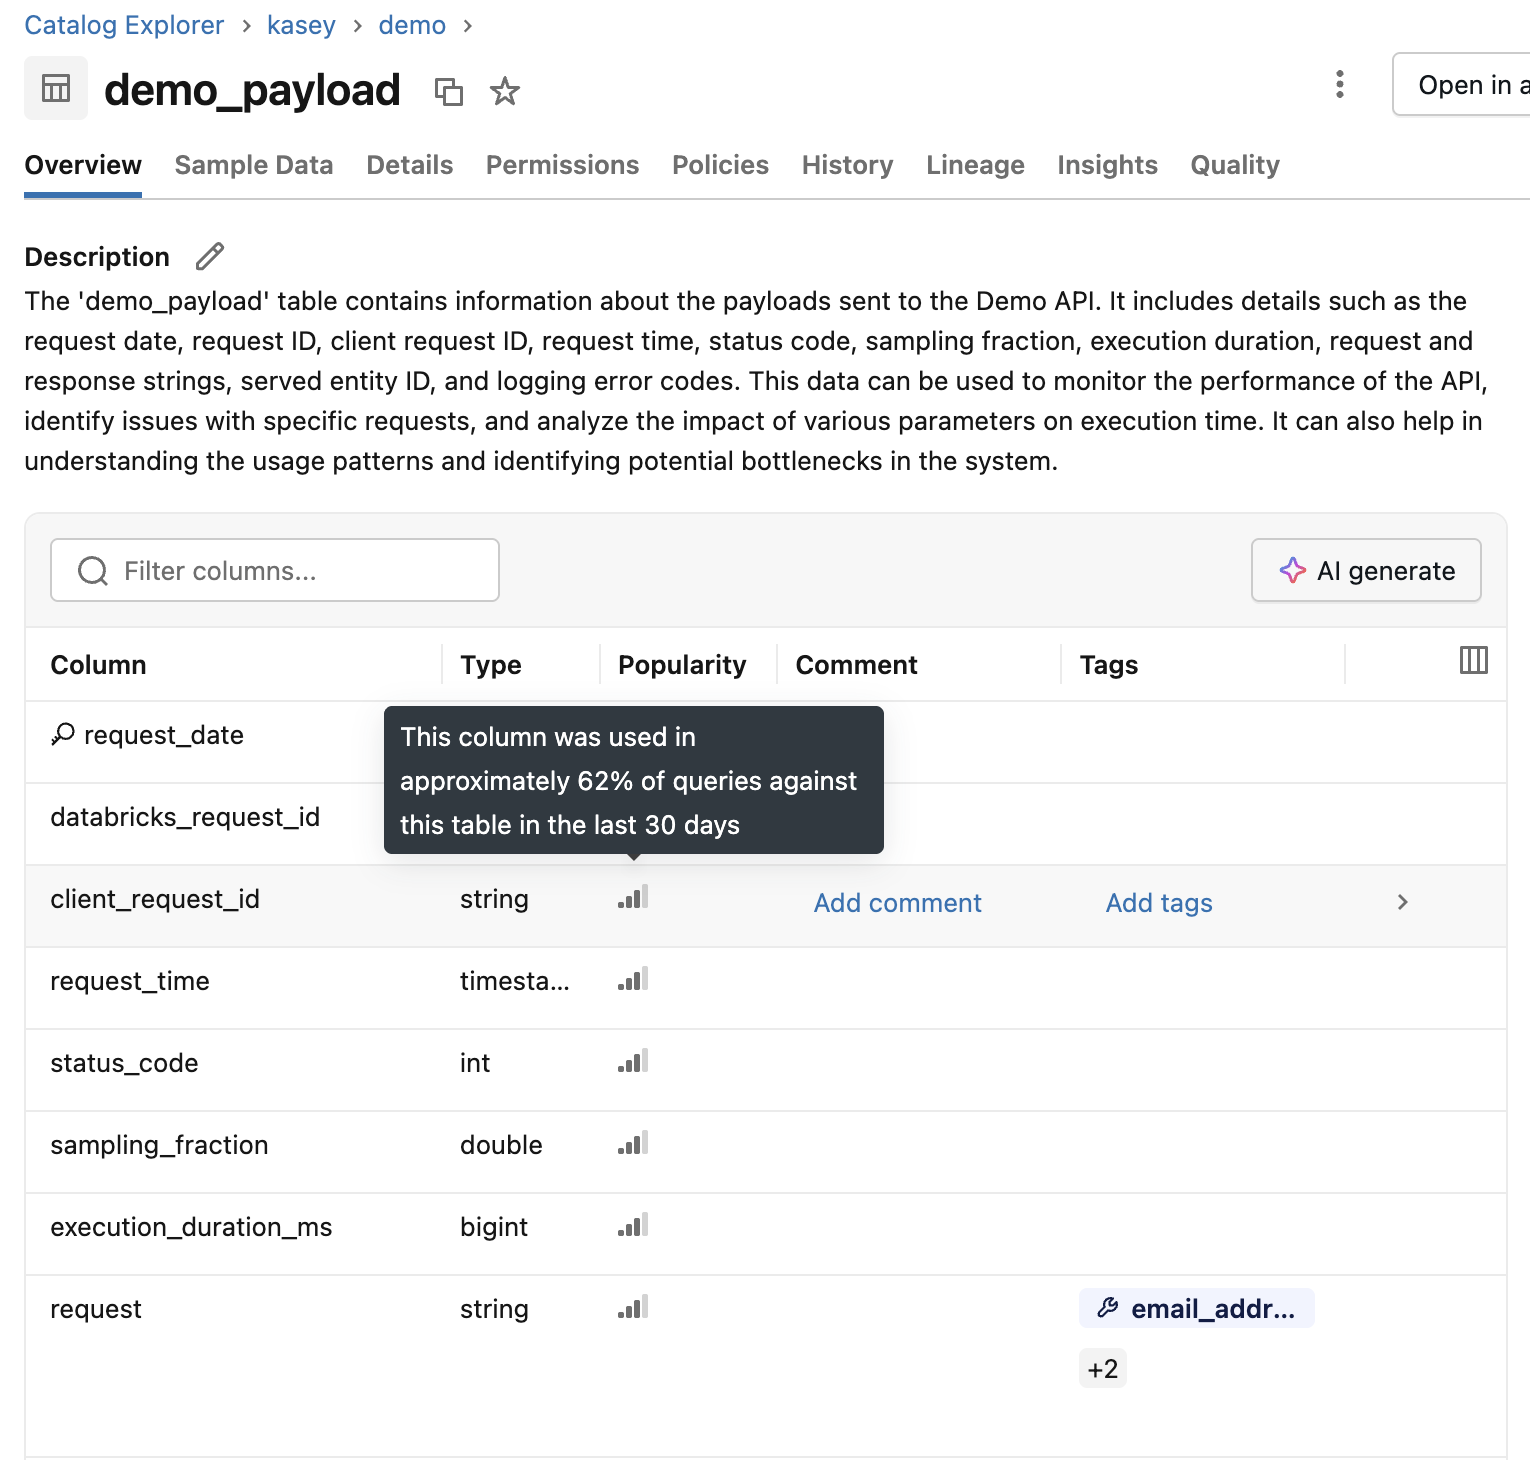
Column popularity: To find the most popular columns in a table, open the table's Overview tab and sort the columns by popularity. Column popularity is based on queries against the table over the last 30 days. Hover over a column's popularity icon to see the approximate percentage of queries that used the column in the last 30 days.
Limitations
- The frequent queries metric only captures saved queries in the SQL editor.