Develop and debug pipelines with a notebook (legacy)
This feature is in Public Preview.
This article describes how to use a notebook in Lakeflow Spark Declarative Pipelines to develop and debug ETL pipelines.
This page describes the legacy notebook editing experience. The default, recommended experience is the Lakeflow Pipelines Editor. You can use the Lakeflow Pipelines Editor to edit notebooks, or Python or SQL code files for a pipeline. For more information, see Develop and debug ETL pipelines with the Lakeflow Pipelines Editor.
To configure the notebook experience described on this page, you must turn off the Lakeflow Pipelines Editor. See Enable the Lakeflow Pipelines Editor and updated monitoring.
Overview of notebooks in Lakeflow Spark Declarative Pipelines
When you work on a Python or SQL notebook that is configured as source code for an existing pipeline, you can connect the notebook directly to the pipeline. When the notebook is connected to the pipeline, the following features are available:
- Start and validate the pipeline from the notebook.
- View the pipeline's dataflow graph and event log for the latest update in the notebook.
- View pipeline diagnostics in the notebook editor.
- View the status of the pipeline's cluster in the notebook.
- Access the Lakeflow Spark Declarative Pipelines UI from the notebook.
Prerequisites
- You must have an existing pipeline with a Python or SQL notebook configured as source code.
- You must either be the owner of the pipeline or have the
CAN_MANAGEprivilege.
Limitations
- The features covered in this article are only available in Databricks notebooks. Workspace files are not supported.
- The web terminal is not available when attached to a pipeline. As a result, it is not visible as a tab in the bottom panel.
Connect a notebook to a pipeline
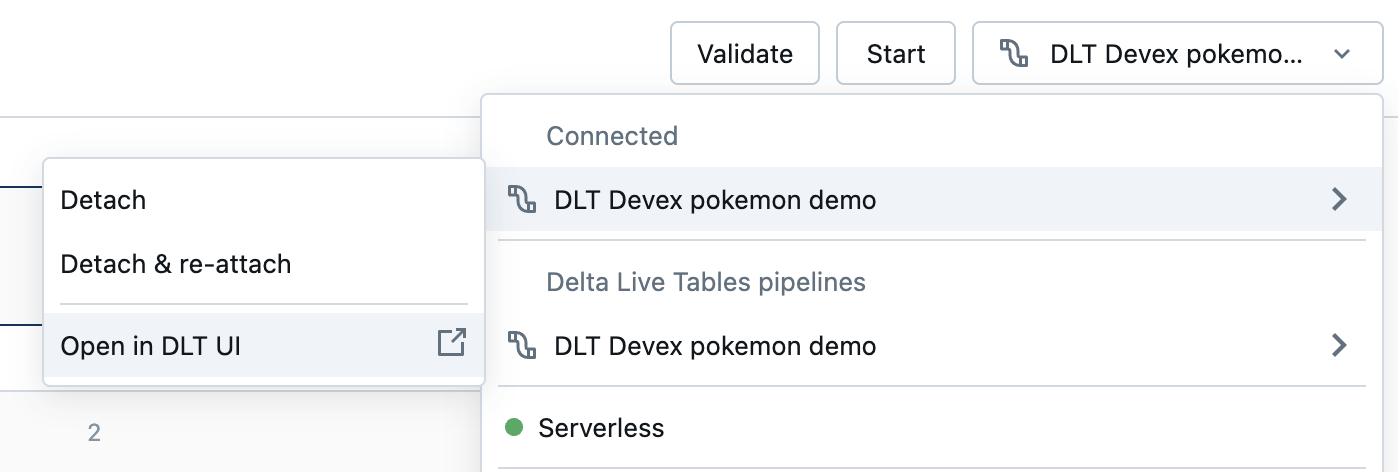
Inside the notebook, click on the drop-down menu used to select compute. The drop-down menu shows all your Lakeflow Spark Declarative Pipelines with this notebook as source code. To connect the notebook to a pipeline, select it from the list.
View the pipeline's cluster status
To easily understand the state of your pipeline's cluster, its status is shown in the compute drop-down menu with a green color to indicate that the cluster is running.
Validate pipeline code
You can validate the pipeline to check for syntax errors in your source code without processing any data.
To validate a pipeline, do one of the following:
- In the top-right corner of the notebook, click Validate.
- Press
Shift+Enterin any notebook cell. - In a cell's dropdown menu, click Validate Pipeline.
If you attempt to validate your pipeline while an existing update is already running, a dialog box displays asking if you want to terminate the existing update. If you click Yes, the existing update stops, and a validate update automatically starts.
Start a pipeline update
To start an update of your pipeline, click the Start button in the top-right corner of the notebook. See Run a pipeline update.
View the status of an update
The top panel in the notebook displays whether a pipeline update is:
- Starting
- Validating
- Stopping
View errors and diagnostics
After you start a pipeline update or validation, any errors are shown inline with a red underline. Hover over an error to see more information.
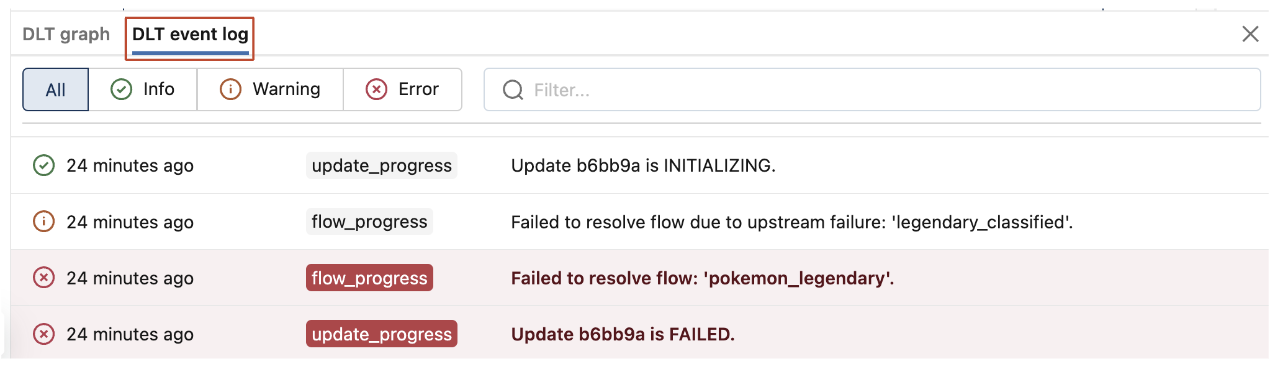
View pipeline events
When attached to a pipeline, there is a Lakeflow Spark Declarative Pipelines event log tab at the bottom of the notebook.
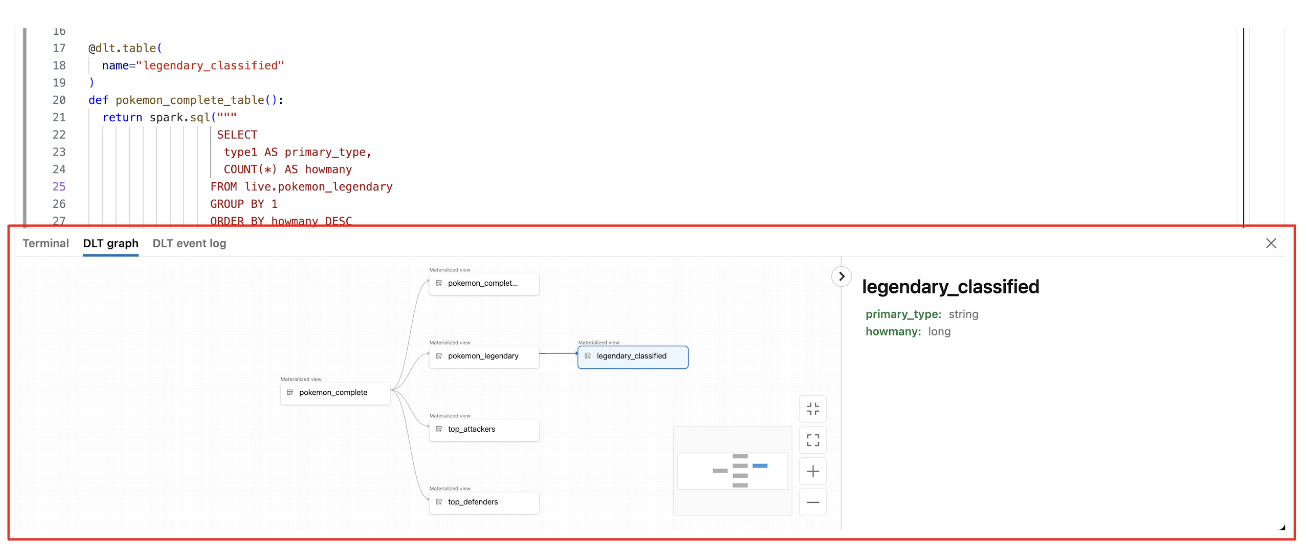
View the pipeline Dataflow Graph
To view a pipeline's dataflow graph, use the Lakeflow Spark Declarative Pipelines graph tab at the bottom of the notebook. Selecting a node in the graph displays its schema in the right panel.
How to access the Lakeflow Spark Declarative Pipelines UI from the notebook
To easily jump to the Lakeflow Spark Declarative Pipelines UI, use the menu in the top-right corner of the notebook.
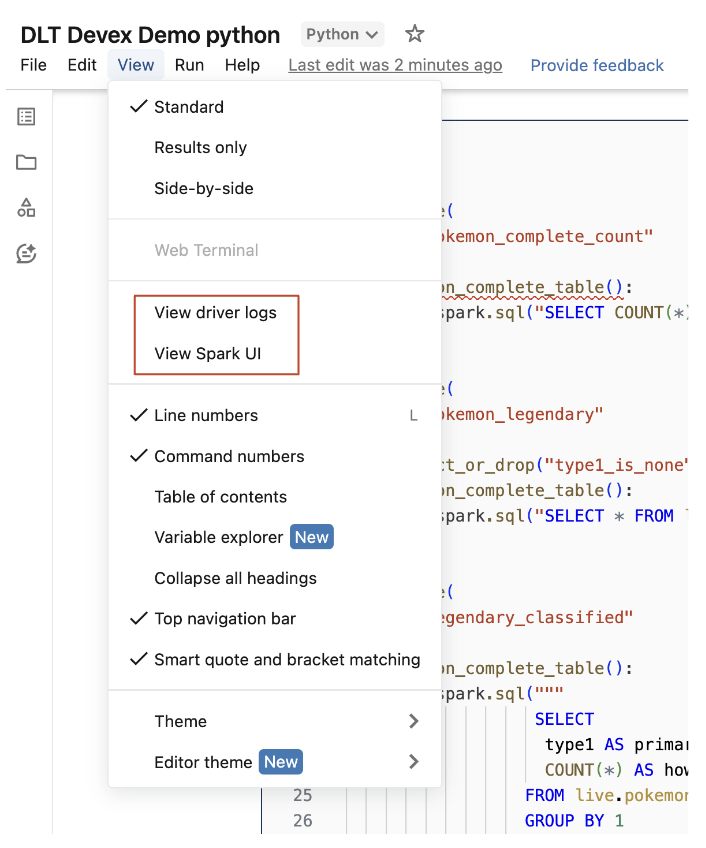
Access driver logs and the Spark UI from the notebook
The driver logs and Spark UI associated with the pipeline being developed can be easily accessed from the notebook's View menu.