Monitor a SQL warehouse
Monitor a SQL warehouse from the Databricks UI. View active queries, warehouse status, cluster count, and more.
To use SQL queries and system tables to monitor a SQL warehouse, see Example queries for monitoring SQL warehouse activity.
View SQL warehouse monitoring metrics
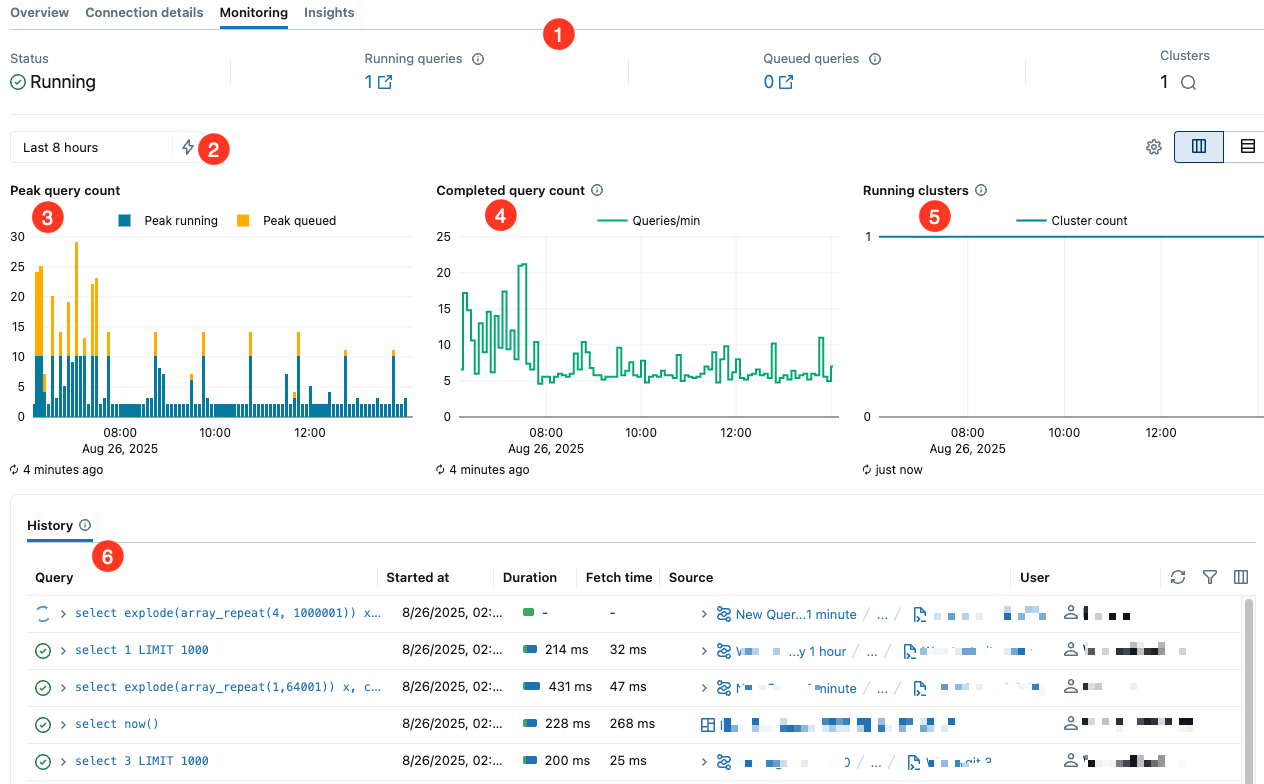
To monitor a SQL warehouse, click the name of a SQL warehouse and then the Monitoring tab. On the Monitoring tab, you see the following monitoring elements:
-
Live statistics: Live statistics appear near the top of the page. From left to right, they indicate the warehouse status, the number of running queries, the number of queued queries, and the warehouse's current cluster count.
noteThe cluster count can be greater than one only if scaling is enabled and configured.
-
Time scale filter: The time scale filter sets the time range for the query count chart, running cluster chart, and query history. The default time range is 8 hours, but you can use the
 lightning bolt icon to select a period of 24 hours, 7 days, or 14 days. You can also set a custom period using the calendar or by clicking and dragging on the bar chart.
 -
Peak query count chart: This chart shows the warehouse's maximum number of concurrent queries, both running and queued, during the selected time frame. The data that supplies this chart does not include metadata queries. Each data point represents the peak in a 5-minute window.
-
Completed query count chart: This chart shows the number of queries completed in the selected time frame, including canceled and failed queries. Queries appear on the chart upon completion, with counts averaged per minute.
-
Running clusters chart: This chart shows the number of clusters allocated to the warehouse during the selected time frame. During a cluster recycle, this count might temporarily exceed the configured maximum. Enable Activity details (Beta) to see color-coded annotations that explain why the warehouse was running during each time interval. See Activity details.
-
Query history table: This table lists all queries active in the selected time frame. Columns show the following details:
- Query: Click the arrow to preview the query text. Click Expand query text to see more.
- Query start time: Shows when the query started running.
- Duration: Hover over the duration to see the duration broken down by scheduling and running times.
- Fetch time (Beta): When a query is actively fetching, no time is shown. When a fetch is complete, the time shows in the table.
- Query source: Shows the originating source, such as pipeline, Genie Space, or dashboard, where the query run is initiated.
- User that ran the query: Shows the name of the user who ran the query.
You can filter the queries by user, duration, status, and statement type.
noteWith Activity details enabled in the Running clusters chart, click the gray bars to filter this table to queries in the fetching state.
Activity details
Enable Activity details to see color-coded annotations that explain why the warehouse was running during each time interval. Activity data refreshes every 5-10 minutes.
This feature is in Beta. Workspace admins can control access to this feature from the Previews page. See Manage Databricks previews.
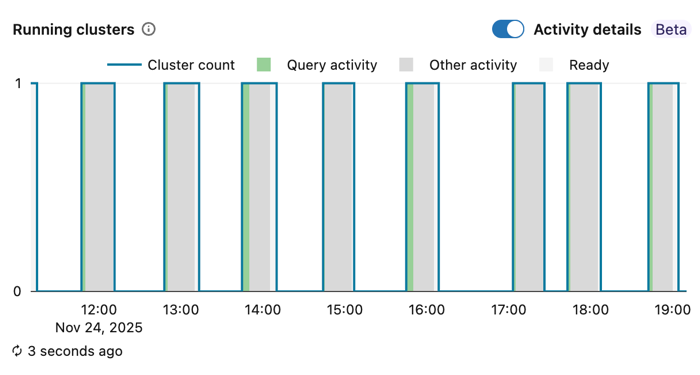
Activity annotations:
- Query activity: The warehouse was processing query activity, including running queries, queued queries, or queries that recently completed.
- Other activity: The warehouse was active due to queries fetching results or open sessions without active queries.
- Ready: The warehouse was ready to run workloads but had no active query or session activity.
To interact with activity details:
- View metadata: Hover over any colored bar to see additional context, such as statement IDs, user email addresses, and client applications.
- Filter query history: Click the gray bars (fetching queries) to automatically filter the query history table to queries in the fetching state during that time period.
Monitor long fetch times
This feature is in Beta. Workspace admins can control access to this feature from the Previews page. See Manage Databricks previews.
SQL warehouses remain active when queries are running or fetching results. Most queries return results within seconds, but some queries can take several minutes due to large result sets, delayed fetching, or queries that clients haven't closed. Knowing which queries are fetching helps you understand why a warehouse remains active when no queries appear to be running.
You can also use the Activity details toggle in the Running clusters chart to visually identify time periods when fetching queries kept the warehouse active. Gray bars indicate fetching activity, and you can click them to filter the query history table.
To view queries that are fetching:
- Click
 the search icon next to Clusters. A panel showing queries in a fetching state appears over the query history table.
 - Click Exit to return to the query history table.
To stop queries in the fetching state:
- Click the query to open the Query Profile panel.
- Click Stop to the right of Result fetching by client.