Create and manage dashboard datasets
This article explains how to create and manage dashboard datasets using the dataset editor in an AI/BI dashboard.
Define datasets
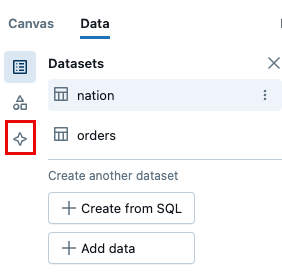
To define or access existing datasets, click the Data tab near the upper-left corner of your dashboard. For information about number of datasets each dashboard can include, see Dashboard limits.
Dashboard queries are read-only. Commands like DESCRIBE, EXPLAIN, CREATE TABLE, INSERT, or DELETE are not supported for defining datasets. Only queries that can be wrapped in additional SQL are valid.
To define a dataset:
- Click the Data tab in the upper-left corner of your dashboard.
- Choose one of the following options:
- Add data: Use this option to either select a Unity Catalog object, create a dashboard local metric view, or upload a file:
- Select a Unity Catalog object: Choose a table, view, or metric view as a data source. For most tables and views, datasets are defined by a default
SELECT *query, which you can modify. When you choose a metric view as a data source, the dataset shows the result table and schema as defined in the metric view. See Use metric views. - Create a local metric view: Use the visual interface to define dimensions, measures, and joins scoped to your dashboard, without publishing to Unity Catalog. See Local metric views and Export as a metric view.
- Upload file: Upload a new asset to Unity Catalog. Click Upload file and select the Catalog, Schema, and Table name. You can set a specific SQL warehouse to handle the compute associated with this upload. You can also choose to Create a new table or Overwrite existing table. You must have
MANAGEprivileges on the selected schema to overwrite an existing table.
- Select a Unity Catalog object: Choose a table, view, or metric view as a data source. For most tables and views, datasets are defined by a default
- Add SQL dataset: Use this option to write a new SQL query on any data source.
- Add data: Use this option to either select a Unity Catalog object, create a dashboard local metric view, or upload a file:
Add a SQL dataset
You can define a dataset that pulls from any available data source. In the query, identify a data source using a fully-qualified table name in the query itself or by selecting a combination of catalog and schema from the drop-down selectors along with the table name in the query. A fully-qualified table name in the query overrides the catalog and schema selectors in the editor. If a table or column name includes spaces, wrap those identifiers in backticks in your SQL queries.
Restrict dataset results using SQL
Dashboard viewers can access all data in a dataset, even if it's not shown in visualizations. To prevent sensitive data from being exposed in the browser, restrict the columns in the SQL query that defines the dataset. For example, instead of selecting all columns from a table, include only the specific fields required for visualizations.
Databricks recommends that you:
- Avoid
SELECT *. Instead, explicitly select only the required columns. - Use
WHEREclauses or other query logic to ensure only the needed rows are included. - Be aware of how parameters can expand dataset access when constructing queries.
- Review the schema in the Result Table to confirm only intended fields are available.
Use metric views
You can use metric views in dashboards by creating a local metric view, selecting a Unity Catalog metric view as a data source, or referencing a metric view in a SQL query.
-
Create a local metric view: When you select a table or view as a data source, the local metric view UI opens. Use the visual interface to define dimensions, measures, and joins scoped to your dashboard, without publishing to Unity Catalog. See Local metric views.
-
Select a Unity Catalog metric view as a data source: When you choose a metric view directly, the dataset includes all defined dimensions and measures. You cannot modify the dataset query to exclude columns or apply filters. You can add custom calculations to create additional measures or dimensions for visualization. See What are custom calculations?.
-
Reference a metric view in a query: You can reference a metric view in a SQL query like any other view. Use this method if you want to filter or reshape the dataset. All metric view measures must be accessed using the
MEASUREaggregate function. Seemeasureaggregate function.
To create a new metric view as you author your dashboard, see Export as a metric view.
Manage datasets
After defining a dataset, use the ![]() kebab menu to the right of the dataset name to access the following options:
kebab menu to the right of the dataset name to access the following options:
-
Rename: Give your dataset a descriptive name so you and your team can quickly identify the queries you want to edit or review.
-
Suggest name: Automatically generate a suggested name based on the query. You can edit this name after it's generated.
-
Clone: Create an in-place copy of your query. You can edit the query after it is cloned.
-
Delete: Delete a dataset. This option is unavailable if the dataset is being used on the canvas.
-
Download: You can download the dataset as a CSV, TSV, or Excel file.
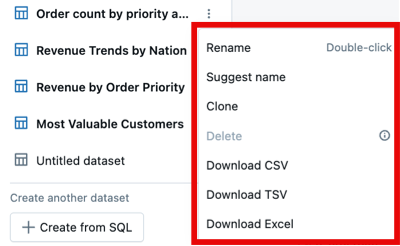
Datasets currently in use on the canvas appear in bold text with a blue icon, while unused datasets have a grey icon and non-bolded names.
View the results table
When you create a dataset, the query runs automatically, and the results appear as a table in the pane below the editor. Each column includes an icon indicating its data type.
To sort column values:
- Hover over each column to show the
 sort icon.
 - Click the icon to sort the values in ascending or descending order.
View the query result schema
To view the schema of your defined dataset, click Schema to the right of Result Table. The Schema tab lists all fields from the defined dataset. Each field is labeled with an icon denoting the column's datatype. If the underlying tables or views include comments, they appear in the Schema tab.
Generate views from datasets
You can generate materialized views and metric views from your datasets to maintain consistency across your workspace.
Export a dataset as a materialized view
You can export any dataset as a materialized view. Materialized views cache query results and refresh them on a specified schedule, which can reduce query execution time when the same data is accessed repeatedly. See Materialized views.
To export a dataset as a materialized view:
- Click the kebab menu
 to the right of the dataset you want to export.
 - Select Export to Materialized View.
- In the Export to Materialized View panel, use the catalog and schema drop-down selectors to choose where the materialized view is stored. This affects who can access and use the materialized view. See Unity Catalog privileges reference.
- (Optional) Enter a name for the materialized view. By default, the dataset title is converted to a valid materialized view name.
- (Optional) Configure the refresh schedule and other materialized view settings.
- Click Create.
The materialized view is created in the specified Unity Catalog location and can be used by other dashboards and queries across your workspace.
By default, the materialized view is added to the dashboard when you create it. To create a materialized view that is not added to the dashboard, turn off Add materialized view to dashboard near the bottom of the Export to Materialized View panel.
Export as a metric view
This feature is in Public Preview.
Metric views abstract complex business logic into a centralized definition, allowing organizations to define key performance indicators once and use them consistently across various reporting surfaces.You can export a dataset as a metric view or use Genie Code to help create a metric view. If measures and dimensions have been defined for the existing dataset, they automatically appear in the generated metric view definition.
Export a dataset as a metric view
To export a dataset as a metric view:
- Click the kebab menu to the right of the dataset you want to export as a metric view.
- In the Create Metric View panel, use the catalog and schema drop-down selectors to choose the schema and catalog where the metric view is stored. This affects who can access and use the metric view. See Unity Catalog privileges reference.
- (Optional) Enter a name for the metric view. By default, the dataset title is converted to a valid metric view name based on naming requirements.
- (Optional) Edit the metric view by adjusting the generated content in the YAML definition section.
- Click Save.
By default, the metric view is added to the dashboard when you create it. To create a metric view that is not added to the dashboard, turn off Add metric view to dashboard near the bottom of the Create Metric View panel.
Create a metric view using Genie Code
Create a metric view from a dataset using Genie Code:
- Click the
 Genie Code icon in the left sidebar of the dataset editor. Then, click Export to Metric View.
- Enter a description of the metric view you want to create.
- Genie Code returns a sample metric view definition and briefly explains the dimensions and measures defined in it.
- Click Open metric view editor to edit and save the metric view.
See Create and edit metric views for more details about creating a metric view.
Custom calculations
Custom calculations offer a way to apply calculations to an existing dataset without modifying the SQL that creates the dataset. To learn more about creating and using custom calculations, see What are custom calculations?.
Write multi-statement queries
Sometimes, you might want to construct a dataset using multiple SQL statements. To run multiple statements, end each statement with a semicolon (;). When you run those commands to create the dataset, the output shows the results of the last statement in the editor. This dataset is used for any related visualizations on the canvas.
Statements are local to the dataset in which they are issued. For example, if you create a dataset with a USE statement to set the catalog or schema, that setting applies only to that dataset.
Examples
The following examples demonstrate common uses for multi-statement queries.
Set the catalog and schema
You can write a USE statement to declare the catalog and schema for the table in your query. The following query contains three statements. The first sets the catalog name. The second sets the schema. The SELECT statement references only the table name because the catalog and schema have been set. See USE CATALOG.
USE CATALOG samples;
USE SCHEMA tpch;
SELECT * FROM customer;
Set ANSI mode
You can set a query to run with ANSI_MODE set to TRUE or FALSE. For Databricks SQL, the system default value for ANSI_MODE is TRUE. See ANSI_MODE.
The following query sets ANSI_MODE to FALSE so that invalid data type inputs return NULL instead of throwing an error.
SET ANSI_MODE = FALSE;
SELECT cast('a' AS INTEGER);
Parameterize complex queries
You can use multiple statements to parameterize the view name for a common table expression or other complex query.
The following query creates two temporary views. The SELECT statement uses the IDENTIFIER clause to interpret the input string as a table name. See IDENTIFIER clause.
CREATE TEMPORARY VIEW v1 AS SELECT 1;
CREATE TEMPORARY VIEW v2 AS SELECT 2;
SELECT * FROM IDENTIFIER(:view_name)
Set variables
The following query declares a variable and value in the first statement. The second statement changes the value of the variable. The third statement shows the end value for the variable is 5. See SET variable for details and complete syntax for using temporary variables.
DECLARE VARIABLE myvar1 INT DEFAULT 7;
SET VAR myvar1 = 5;
VALUES (myvar1);