Use query-based parameters
The article guides you through the steps to create an interactive dashboard that uses query-based parameters. It assumes a basic familiarity with building dashboards on Databricks. See Get started for foundational instruction on creating dashboards.
Requirements
- You are logged into a Databricks workspace.
- You have the Databricks SQL entitlement in that workspace.
- You have at least CAN USE access to one or more SQL warehouses.
Create a dashboard dataset
This tutorial uses generated data from the samples catalog on Databricks.
-
Click
 New in the sidebar and select Dashboard from the menu.
 -
Click the Data tab.
-
Click Add SQL dataset and paste the following query into the editor. Then click Run to return the results.
SQLSELECT
*
FROM
samples.tpch.customer -
Your newly defined dataset is autosaved with the name Untitled Dataset. Double-click the title then rename it Marketing segment.
Add a parameter
You can add a parameter to this dataset to filter the returned values. The parameter in this example is :segment. See Work with dashboard parameters to learn more about parameter syntax.
-
Paste the following
WHEREclause at the bottom of your query. A text field with the parameter namesegmentappears below your query.SQLWHERE
c_mktsegment = :segment -
Type
BUILDINGinto the text field below your query to set the default value for the parameter. -
Rerun the query to inspect the results.
Configure a visualization widget
Add a visualization for your dataset on the canvas by completing the following steps:
- Click the Untitled page tab.
- Click
 Add a visualization to add a visualization widget and use your mouse to place it in the canvas.
Setup the X-axis
- If necessary, select Bar from the Visualization dropdown menu.
- Click
 to choose the data presented along the X-axis. You can use the search bar to search for a field by name. Select c_nationkey.
 - Click the field name you selected to view additional configuration options.
- As the Scale Type, select Categorical.
- For the Transform selection, choose None.
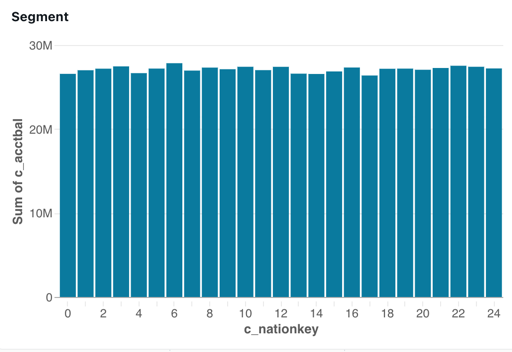
Setup the Y-axis
- Click next to the Y-axis, then select c_acctbal.
- Click the field name you selected to view additional configuration options.
- As the Scale Type, select Continuous.
- For the Transform selection, choose SUM.
The visualization is automatically updated as you configure it. The data shown includes only records where the segment is BUILDING.
Add a filter
Set up a filter so that dashboard viewers can control which marketing segment to focus on.
- Click
 Add a filter (field/parameter) to add a filter widget. Place it on the canvas.
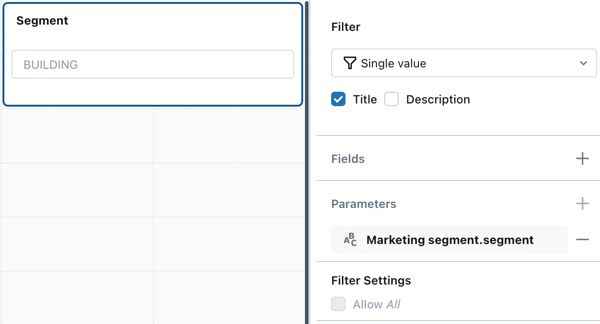
 - From the Filter drop-down menu in the configuration panel, select Single value.
- Select the Title checkbox to show a title field on your filter widget.
- Click the placeholder title on the widget and type Segment to retitle your filter.
- Click next to Parameters in the configuration panel.
- Choose segment from the Marketing segment dataset.
Your configured filter widget shows the default parameter value for the dataset.
Define a selection of values
The filter you created is functional, but it requires the viewer to know the available range of choices before they can type a selection. It also requires that users match the case and spelling when entering the desired parameter value.
To create a drop-down list so that the viewer can select a parameter from a list of available options, create a new dataset to define the list of possible values.
-
Click the Data tab.
-
Click Add SQL dataset to create a new dataset.
-
Copy and paste the following into the editor:
SQLSELECT
DISTINCT c_mktsegment
FROM
samples.tpch.customer -
Run your query and inspect the results. The five marketing segments from the table appear in the results.
-
Double-click the automatically generated title, then rename this dataset Segment choice.
Update the filter
Update your existing filter to use the dataset you just created to populate a drop-down list of values users can select from.
- Click Untitled page. Then, click the filter widget you created in a previous step.
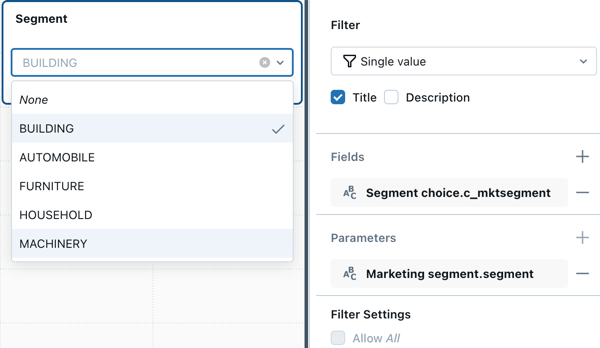
- Click next to Fields.
- Click Segment choice, then click the field name
c_mktsegment.
Your filter widget updates as you change the configuration. Click the field in the filter widget to see the available choices in the drop-down menu.
This tutorial contains a simplified use case meant to demonstrate how to use query-based parameters. An alternate approach to creating this dashboard is to apply a filter to the c_mktsegment field.
Next steps
Keep learning about how to work with dashboards with the following articles:
- Learn more about applying filters. See Use dashboard filters.
- Learn more about dashboard parameters. See Work with dashboard parameters.
- Publish and share your dashboard. See Publish a dashboard.