Data profiling
This article describes data profiling. It gives an overview of the components and usage of data profiling.
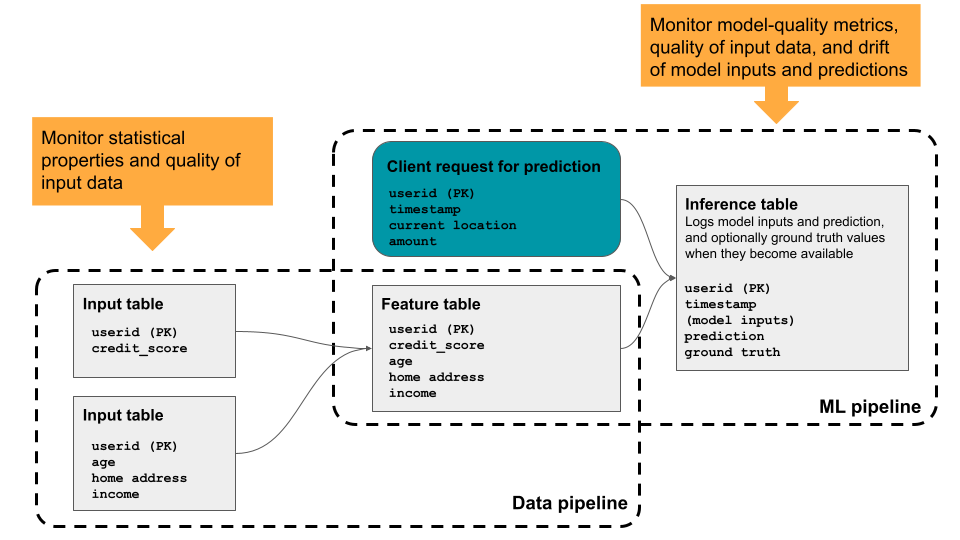
Data profiling provides summary statistics for a table, computing profiling metrics over time so you can easily view historical trends. It is useful for in-depth monitoring of all key metrics for select tables. You can also use it to track the performance of machine learning models and model-serving endpoints by profiling inference tables that contain model inputs and predictions. The diagram shows the flow of data through data and ML pipelines in Databricks, and how you can use profiling to continuously track data quality and model performance.
Why use data profiling?
Quantitative metrics help you track and confirm the quality and consistency of your data over time. When you detect changes in your table's data distribution or corresponding model's performance, the tables created by data profiling can capture and alert you to the change and can help you identify the cause.
Data profiling helps you answer questions like the following:
- What does data integrity look like, and how does it change over time? For example, what is the fraction of null or zero values in the current data, and has it increased?
- What does the statistical distribution of the data look like, and how does it change over time? For example, what is the 90th percentile of a numerical column? Or, what is the distribution of values in a categorical column, and how does it differ from yesterday?
- Is there drift between the current data and a known baseline, or between successive time windows of the data?
- What does the statistical distribution or drift of a subset or slice of the data look like?
- How are ML model inputs and predictions shifting over time?
- How is model performance trending over time? Is model version A performing better than version B?
In addition, data profiling lets you control the time granularity of observations and set up custom metrics.
Requirements
- Your workspace must be enabled for Unity Catalog and you must have access to Databricks SQL.
- To enable data profiling, you must have the following privileges:
USE CATALOGon the catalog andUSE SCHEMAon the schema containing the table.SELECTon the table.MANAGEon the catalog, schema, or table.
Data profiling uses serverless compute for jobs but does not require that your account be enabled for serverless compute. For information about tracking expenses, see View data quality monitoring expenses.
How data profiling works
To profile a table, you create a profile attached to the table. To profile the performance of a machine learning model, you attach the profile to an inference table that holds the model's inputs and corresponding predictions.
Data profiling provides the following types of analysis: time series, inference, and snapshot.
Profile type | Description |
|---|---|
Time series | Use for tables that contain a time series dataset based on a timestamp column. Profiling computes data quality metrics across time-based windows of the time series. |
Inference | Use for tables that contain the request log for a model. Each row is a request, with columns for the timestamp , the model inputs, the corresponding prediction, and (optional) ground-truth label. Profiling compares model performance and data quality metrics across time-based windows of the request log. |
Snapshot | Use for all other types of tables. Profiling calculates data quality metrics over all data in the table. The complete table is processed with every refresh. The maximum table size for a snapshot profile is 4TB. For larger tables, use time series profiles instead. |
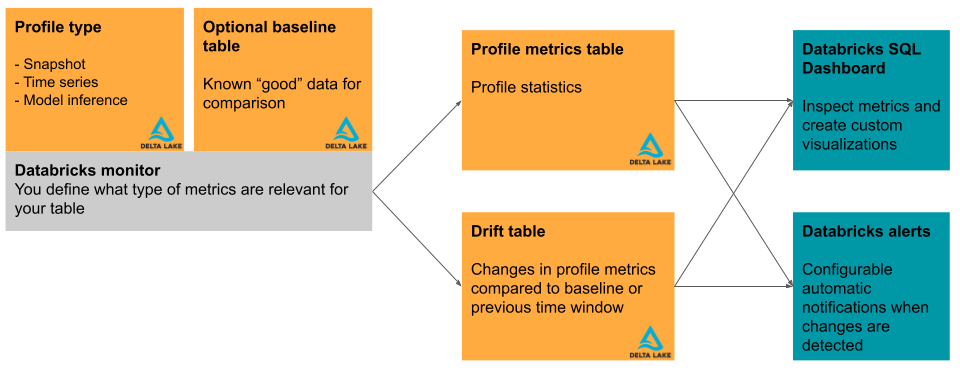
This section briefly describes the input tables used by data profiling and the metric tables it produces. The diagram shows the relationship between the input tables, the metric tables, the profile, and the dashboard.
Primary table and baseline table
In addition to the table to be profiled, called the “primary table”, you can optionally specify a baseline table to use as a reference for measuring drift, or the change in values over time. A baseline table is useful when you have a sample of what you expect your data to look like. The idea is that drift is then computed relative to expected data values and distributions.
The baseline table should contain a dataset that reflects the expected quality of the input data, in terms of statistical distributions, individual column distributions, missing values, and other characteristics. It should match the schema of the profiled table. The exception is the timestamp column for tables used with time series or inference profiles. If columns are missing in either the primary table or the baseline table, profiling uses best-effort heuristics to compute the output metrics.
For profiles that use a snapshot profile, the baseline table should contain a snapshot of the data where the distribution represents an acceptable quality standard. For example, on grade distribution data, one might set the baseline to a previous class where grades were distributed evenly.
For profiles that use a time series profile, the baseline table should contain data that represents time windows where data distributions represent an acceptable quality standard. For example, on weather data, you might set the baseline to a week, month, or year where the temperature was close to expected normal temperatures.
For profiles that use an inference profile, a good choice for a baseline is the data that was used to train or validate the model being profiled. In this way, users can be alerted when the data has drifted relative to what the model was trained and validated on. This table should contain the same feature columns as the primary table, and additionally should have the same model_id_col that was specified for the primary table's InferenceLog so that the data is aggregated consistently. Ideally, the test or validation set used to evaluate the model should be used to ensure comparable model quality metrics.
Metric tables and dashboard
Profiling creates two metric tables and a dashboard. Metric values are computed for the entire table, and for the time windows and data subsets (or “slices”) that you specify when you create the profile. In addition, for inference analysis, metrics are computed for each model ID. For more details about the metric tables, see Data profiling metric tables.
- The profile metric table contains summary statistics. See the profile metrics table schema.
- The drift metrics table contains statistics related to the data's drift over time. If a baseline table is provided, drift is also profiled relative to the baseline values. See the drift metrics table schema.
The metric tables are Delta tables and are stored in a Unity Catalog schema that you specify. You can view these tables using the Databricks UI, query them using Databricks SQL, and create dashboards and alerts based on them.
For each profile, Databricks automatically creates a dashboard to help you visualize and present the profile results. The dashboard is fully customizable. See Dashboards.
Limitations
- Only Delta tables are supported for profiling, and the table must be one of the following table types: managed tables, external tables, views, materialized views, or streaming tables.
- Profiles created over materialized views do not support incremental processing.
- Not all regions are supported. For regional support, see the column Data profiling in the table AI and machine learning features availability.
- Profiles created using the time series or inference analysis modes only compute metrics over the last 30 days. If you need to adjust this, contact your Databricks account team.
- The maximum table size for a snapshot profile is 4TB. For larger tables, use time series profiles instead.
Start using data profiling
See the following articles to get started:
- Create a profile using the Databricks UI.
- Create a data profile using the API.
- Data profiling metric tables.
- Data profiling dashboard.
- Profile alerts.
- Use custom metrics with data profiling.
- Monitor served models using AI Gateway-enabled inference tables.
- Monitor fairness and bias for classification models.
- See the reference material for the data profiling API.
- Example notebooks.