Debug Databricks notebooks
Databricks notebooks include a built-in interactive debugger, available for Python code only.
The interactive debugger provides breakpoints, step-by-step execution, variable inspection, and more tools to help you develop code in notebooks more efficiently.
Requirements
To access the debugger, your notebook must be connected to one of the following compute resources:
- Serverless compute
- Compute with access mode set to Standard (formerly shared) in Databricks Runtime 14.3 LTS and above
- Compute with access mode set to Dedicated (formerly single user) in Databricks Runtime 13.3 LTS and above
- Compute with access mode set to No Isolation Shared in Databricks Runtime 13.3 LTS and above
Enable the debugger
Use the following steps to enable the debugger:
- Click your username at the upper-right of the workspace and select Settings from the drop-down list.
- In the Settings sidebar, select Developer.
- In the Editor settings section, turn on Python Notebook Interactive Debugger.
Start debugging
To start the debugger, follow these steps:
-
Add one or more breakpoints by clicking in the gutter of a cell. To remove a breakpoint, click on it again.
-
Start the debugging session by using one of the following options:
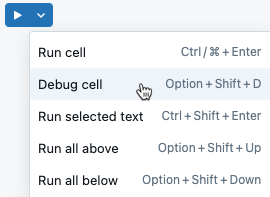
- Click Run > Debug cell.
- Use the keyboard shortcut Option + Shift + D.
- From the cell run menu, select Debug cell.
A debug session starts automatically and runs the selected cell.
You can also start the debugger if a cell triggers an error. At the bottom of the cell output, click ![]() .
.
When a debug session is active, the debug toolbar ![]() appears at the top of the cell.
appears at the top of the cell.
Debugging actions

In a debug session, you can do the following:
- Set or remove breakpoints.
- View the values of variables at a breakpoint.
- Step through the code.
- Step into or out of a function.
- Locate the line the debugger is stopped at.
When the code reaches a breakpoint, it stops before the line is run, not after.
Use the buttons in the debugger toolbar to step through the code. As you step through the code, the current line is highlighted in the cell. You can view variable values in the variable explorer pane in the right sidebar.
When you step through a function, local function variables appear in the variable pane, marked [local].
Step into workspace files
You can set breakpoints and step into functions defined in other workspace files when you Enable tabs for notebooks and files. To step into a function, click the step in icon ![]() . If the function is defined in another workspace file, the debugger will open that file in a new tab.
. If the function is defined in another workspace file, the debugger will open that file in a new tab.
- The debugger can only step into functions defined in files in the workspace. Stepping into Python libraries or other notebooks is not yet supported.
- If you edit external files after they're imported, the notebook session might still use the old version of the module. To ensure that edits to imported modules take effect during debugging, use autoreload for Python modules in Databricks Runtime 18.0+ or serverless compute environment version 4+.
Debug console
When you start a debugging session, the debug console automatically appears in the bottom panel. This console allows you to execute Python code to inspect or manipulate variables when paused at a breakpoint. Code executed in the main notebook does not run during a debugging session. To run code in the console, press Enter. For multi-line expressions, use Shift + Enter to move to a new line.

- The debug console is designed for quick evaluations and times out if the code execution exceeds 15 seconds.
- The
displaycommand is not supported in the debug console. To view sample data from a DataFrame, usedf.show()for PySpark DataFrames ordf.head()for Pandas DataFrames.
Variable explorer
You can use the variable explorer panel ![]() on the right side to view the values of your variables. Clicking Inspect automatically executes code in the debug console to output the value of your variable.
on the right side to view the values of your variables. Clicking Inspect automatically executes code in the debug console to output the value of your variable.
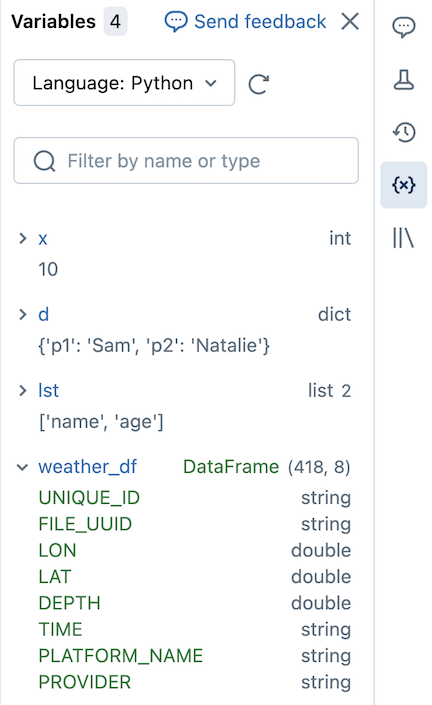
To filter the display, enter text into the search box. The list is automatically filtered as you type.
For Python on Databricks Runtime 12.2 LTS and above, the variables update as a cell runs. For Scala, R, and for Python on Databricks Runtime 11.3 LTS and below, variables update after a cell finishes running.
Terminate a debugger session
To end the debugging session, click ![]() at the upper-left of the cell or click
at the upper-left of the cell or click ![]() at the top of the notebook. The debug session also automatically terminates after 30 minutes if the user does not use the debugging toolbar or debug console.
at the top of the notebook. The debug session also automatically terminates after 30 minutes if the user does not use the debugging toolbar or debug console.
Debug with Genie Code
Genie Code can diagnose errors and suggest fixes in your notebook code. See Genie Code command shortcuts for notebooks for more information.
Limitations
See Known limitations of Databricks notebooks for more information.