Gaps between Spark jobs
So you see gaps in your jobs timeline like the following:
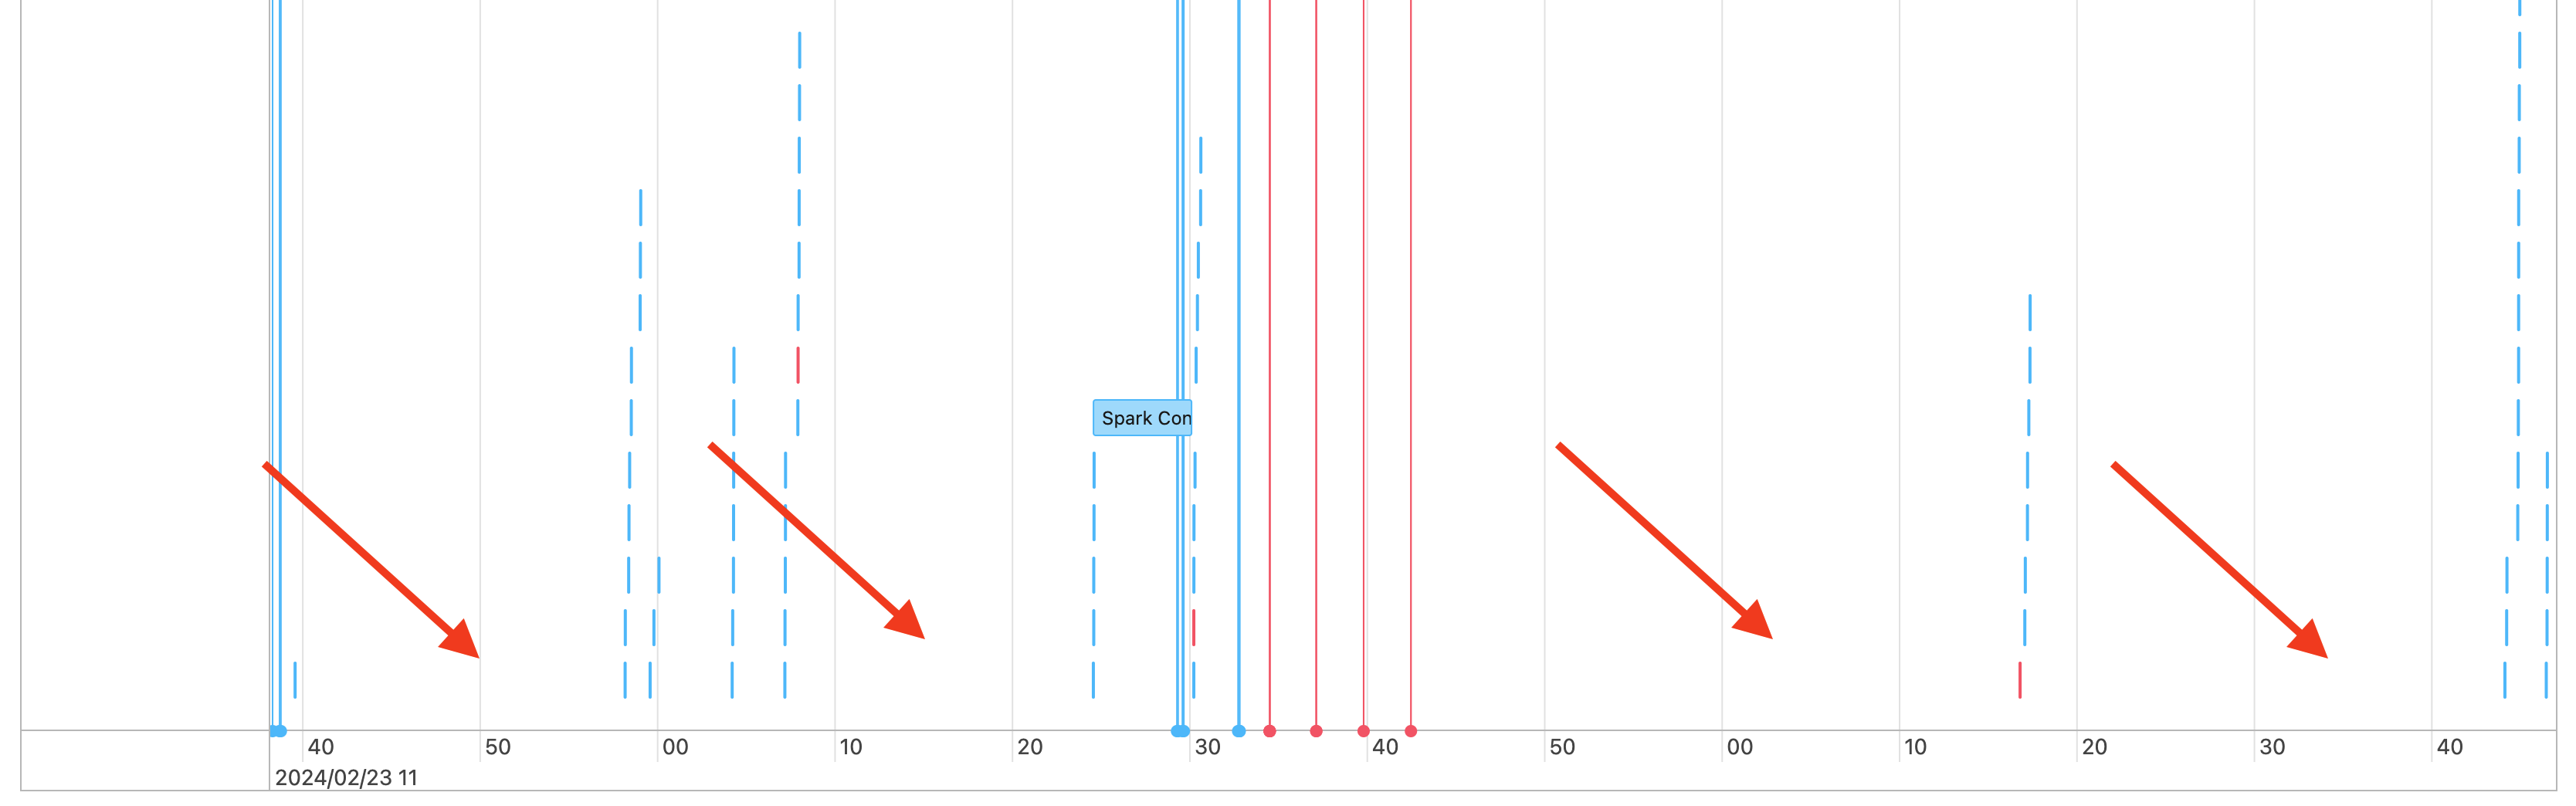
There are a few reasons this could be happening. If the gaps make up a high proportion of the time spent on your workload, you need to figure out what is causing these gaps and if it's expected or not. There are a few things that could be happening during the gaps:
- There's no work to do
- Driver is compiling a complex execution plan
- Execution of non-spark code
- Driver is overloaded
- Cluster is malfunctioning
No work
On all-purpose compute, having no work to do is the most likely explanation for the gaps. Because the cluster is running and users are submitting queries, gaps are expected. These gaps are the time between query submissions. Consider using serverless compute instead. With serverless you will not pay for idle time, potentially significantly reducing the cost.
Complex execution plan
For example, if you use withColumn() in a loop, it creates a very expensive plan to process. The gaps could be the time the driver is spending simply building and processing the plan. If this is the case, try simplifying the code. Use selectExpr() to combine multiple withColumn() calls into one expression, or convert the code into SQL. You can still embed the SQL in your Python code, using Python to manipulate the query with string functions. This often fixes this type of problem.
Execution of non-Spark code
Spark code is either written in SQL or using a Spark API like PySpark. Any execution of code that is not Spark will show up in the timeline as gaps. For example, you could have a loop in Python which calls native Python functions. This code is not executing in Spark and it can show up as a gap in the timeline. If you're not sure if your code is running Spark, try running it interactively in a notebook. If the code is using Spark, you will see Spark jobs under the cell:
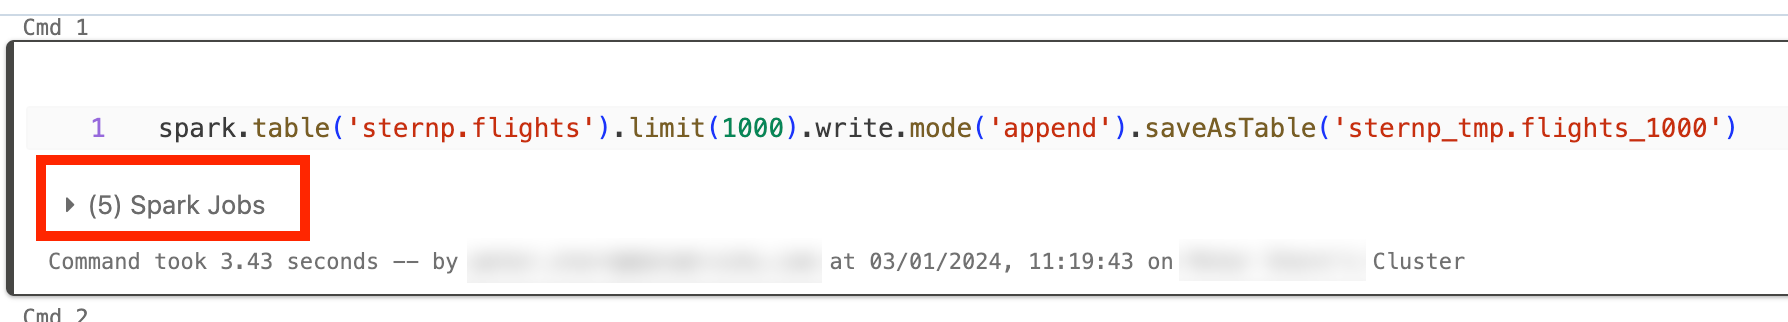
You can also expand the Spark Jobs drop-down under the cell to see if the jobs are actively executing (in case Spark is now idle). If you're not using Spark you won't see the Spark Jobs under the cell, or you will see that none are active. If you can't run the code interactively, you can try logging in your code and see if you can match the gaps up with sections of your code by time stamp, but that can be tricky.
If you see gaps in your timeline caused by running non-Spark code, this means your workers are all idle and likely wasting money during the gaps. Maybe this is intentional and unavoidable, but if you can write this code to use Spark you will fully utilize the cluster. Start with this tutorial to learn how to work with Spark, or if the non-Spark code is intentional, consider using serverless compute instead. With serverless you will not pay for idle time, potentially significantly reducing the cost.
Driver is overloaded
To determine if your driver is overloaded, you need to look at the cluster metrics.
If your cluster is on Databricks Runtime 13.0 or later, click Metrics as highlighted in this screenshot:
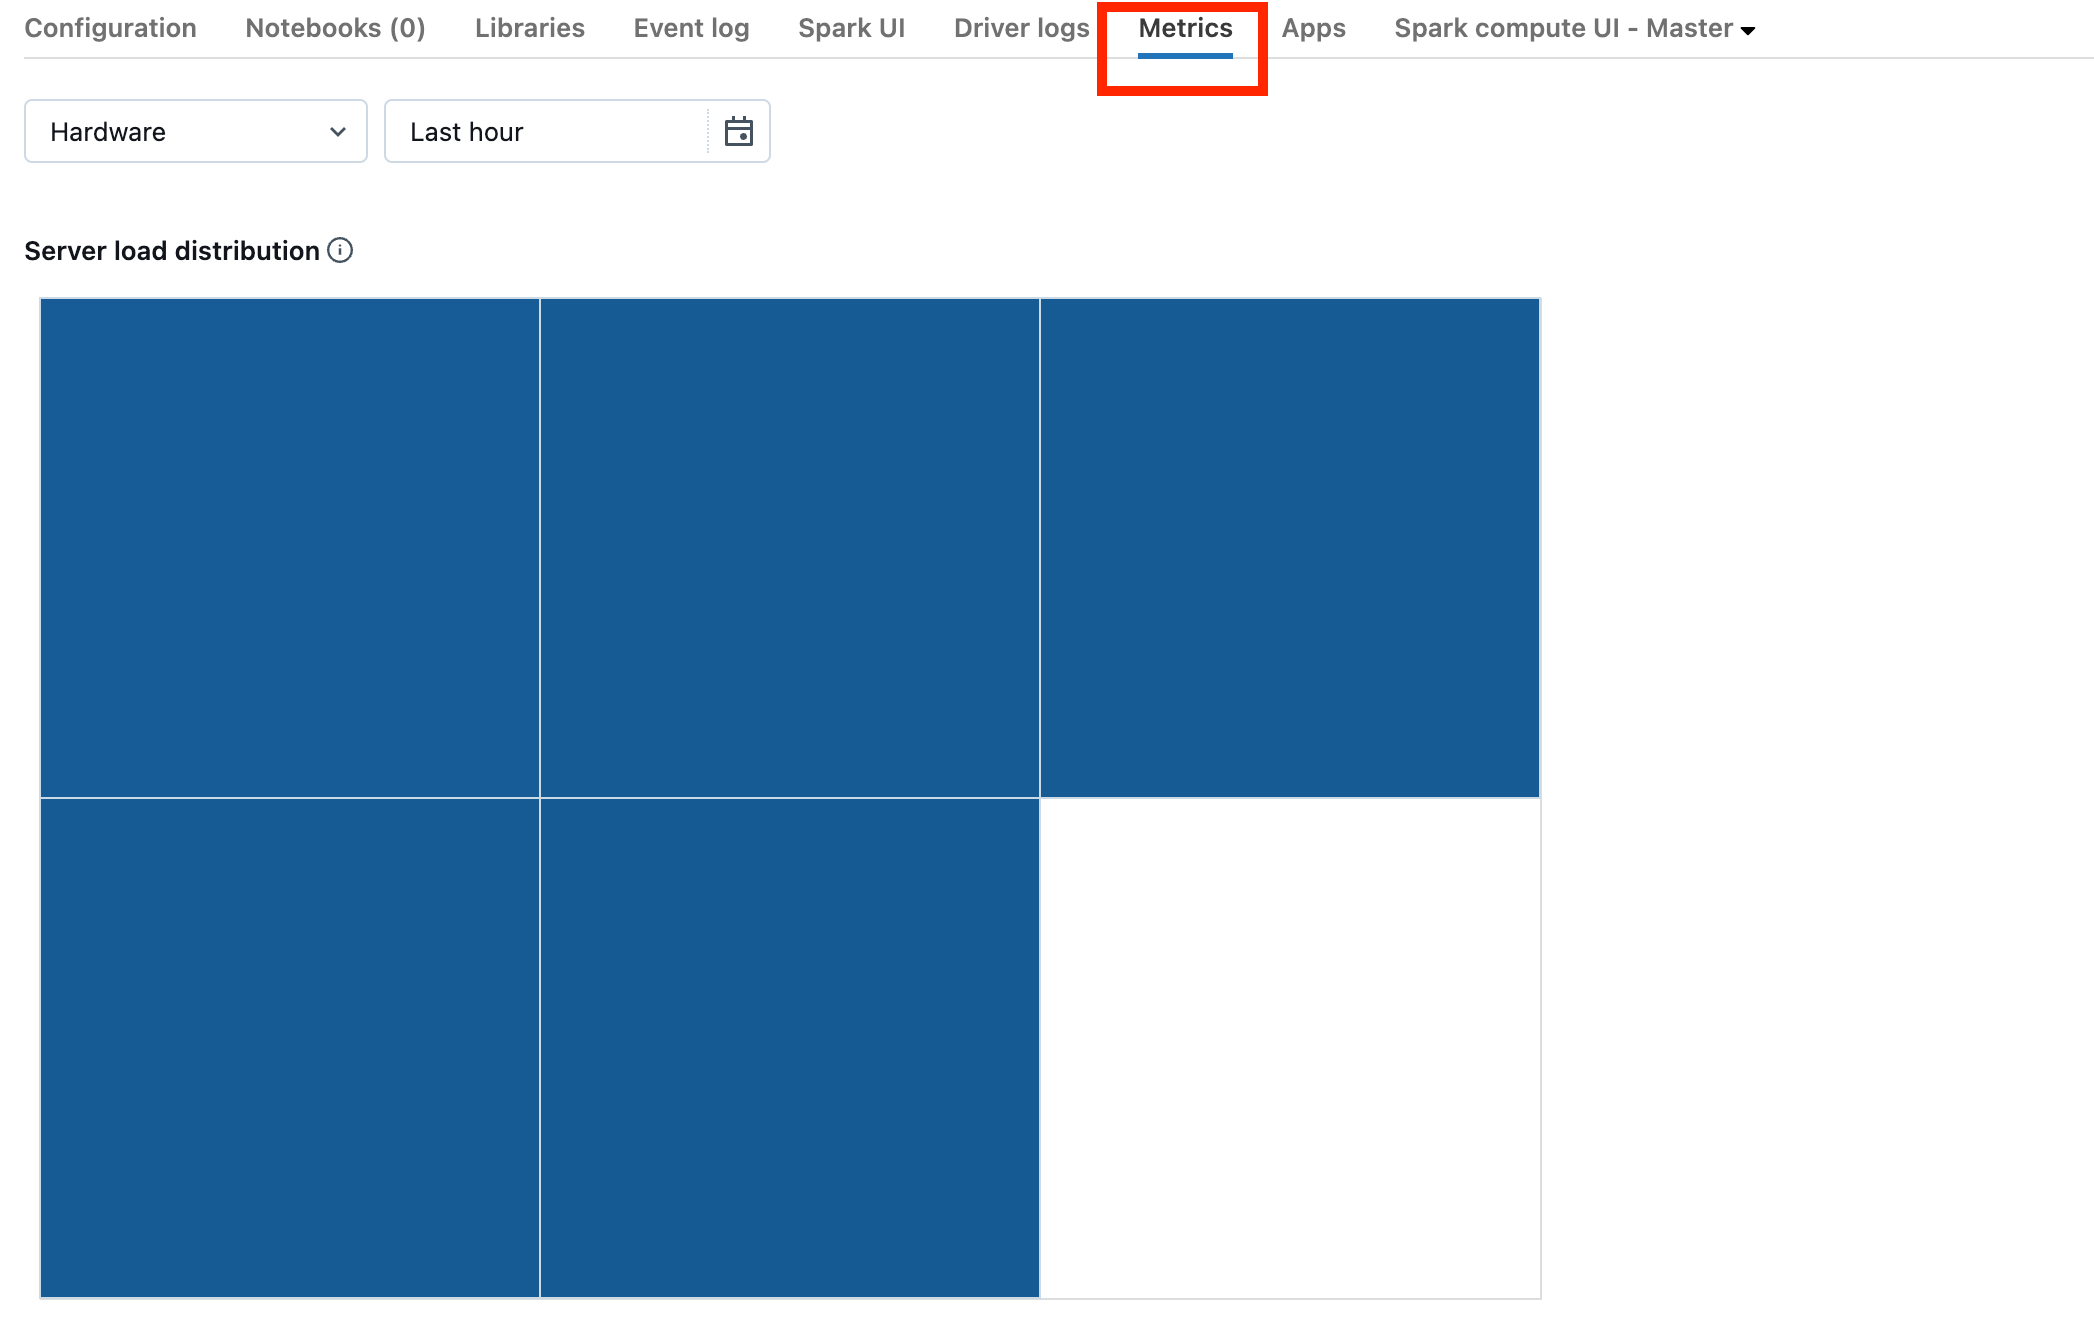
Notice the Server load distribution visualization. You should look to see if the driver is heavily loaded. This visualization has a block of color for each machine in the cluster. Red means heavily loaded, and blue means not loaded at all.
The previous screenshot shows a basically idle cluster. If the driver is overloaded, it would look something like this:
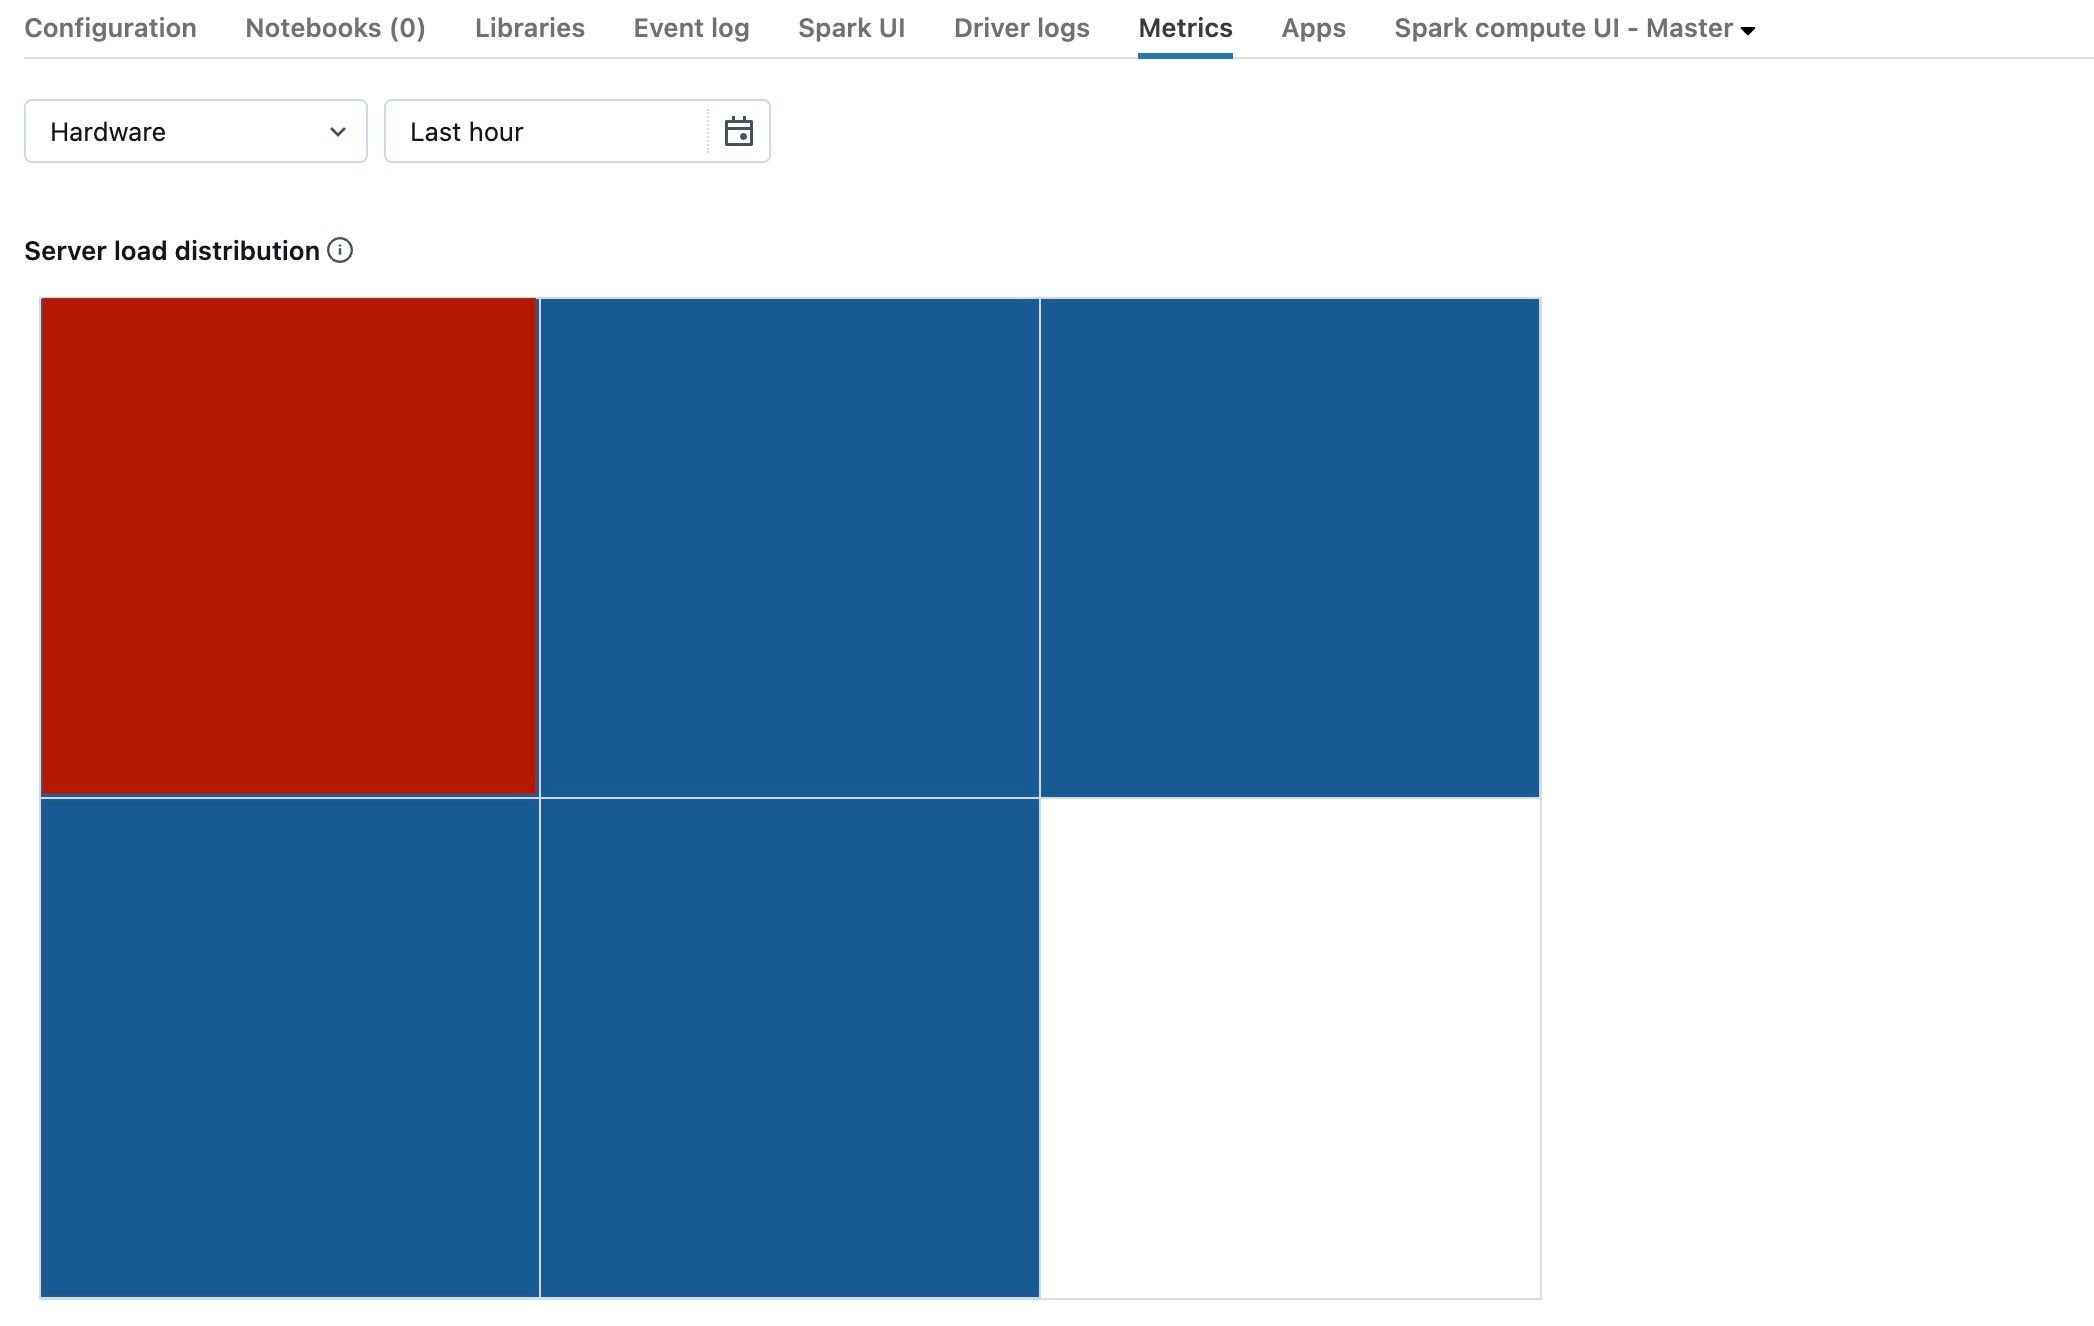
We can see that one square is red, while the others are blue. Roll your mouse over the red square to make sure the red block represents your driver.
To fix an overloaded driver, see Spark driver overloaded.
Cluster is malfunctioning
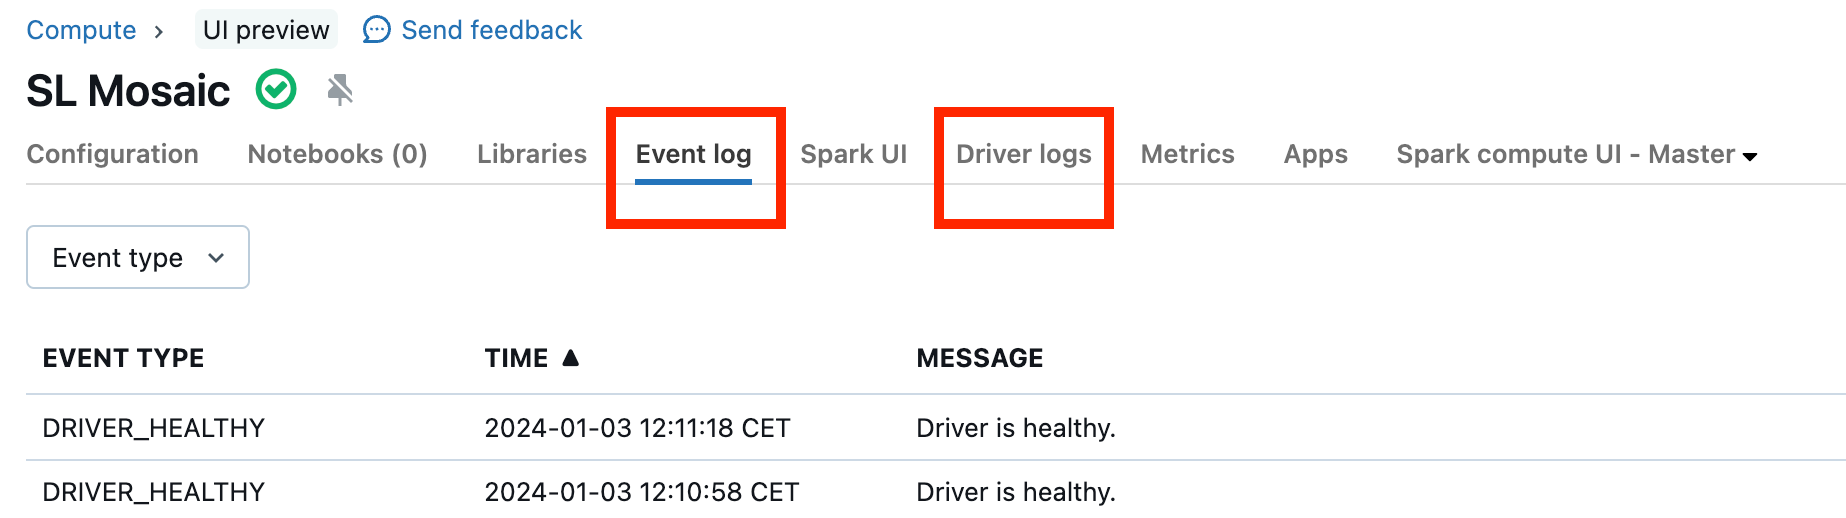
Malfunctioning clusters are rare, but if this is the case it can be difficult to determine what happened. You may just want to restart the cluster to see if this resolves the issue. You can also look into the logs to see if there's anything suspicious. The Event log tab and Driver logs tabs, highlighted in the screenshot below, will be the places to look:
You may want to enable Cluster log delivery in order to access the logs of the workers. You can also change the log level, but you might need to reach out to your Databricks account team for help.