Databricks SQL alerts
This page provides step-by-step guidance for enabling and using Databricks SQL alerts to automate query execution, evaluate custom conditions, and deliver notifications when those conditions are met. With alerts, you can proactively monitor your business data and receive timely notifications whenever reported values fall outside of expected thresholds. When you schedule an alert, its associated query runs and the alert criteria are checked, regardless of any existing schedules on the underlying query. Additionally, you can access an alert history to review the results of past alert evaluations.
To learn how to work with legacy alerts instead, see What are legacy alerts?.
Enable alerts in your workspace
This feature is in Public Preview. Workspace admins can control workspace access to this preview from the Previews page. Enabling this preview doesn't impact your existing alerts; you can continue using both these and legacy alerts in parallel.
View and organize alerts
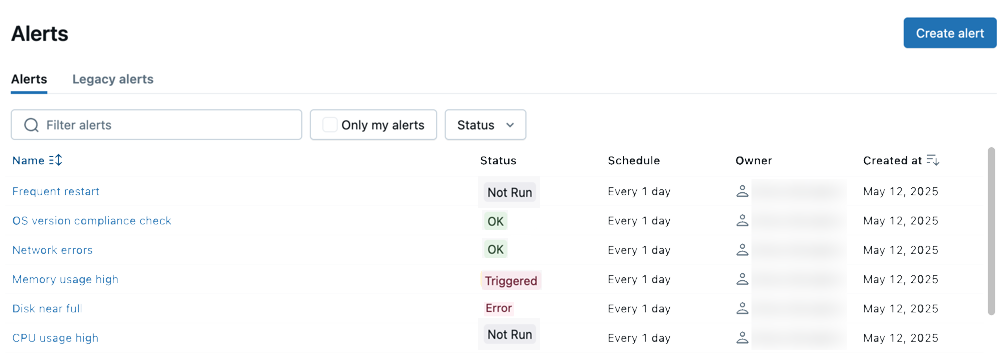
Click the Alerts in the sidebar to open the alerts listing page.

-
The Alerts tab is open by default and shows all alerts in the workspace. You can type to filter by name. Click Only my alerts to show only alerts where you are the owner.
-
The Legacy alerts tab shows alerts that were created using the previous alerts system.
-
Name shows the string name of each alert.
-
Status shows whether the alert status is
TRIGGERED,OK, orERROR. -
Schedule shows the last updated time or date.
-
Owner shows the username of the person who owns the alert.
-
Created at shows the date and time the alert was created.
TRIGGEREDmeans that on the most recent execution, the Value column in your target query met the Condition and Threshold you configured. If your alert checks whether "cats" is above 1500, your alert will be triggered as long as "cats" is above 1500.OKmeans that on the most recent query execution, the Value column did not meet the Condition and Threshold you configured. This doesn't mean that the Alert was not previously triggered. If your "cats" value is now 1470, your alert will show asOK.ERRORindicates that an error occurred during alert evaluation.
Create an alert
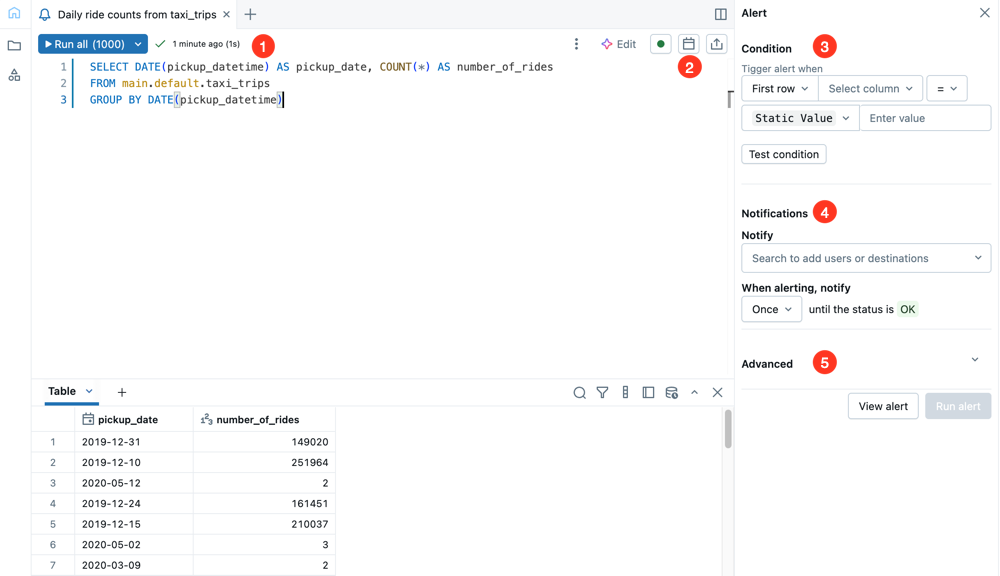
The steps in this section walk you through how to create the alert shown in the following image. Use the labels and explanations to understand each component.

-
Query editor: Write and test the query that you want to alert on.
-
Schedule: Set a periodic schedule for the alert to run.
-
Condition: Select the value threshold that should trigger an alert notification. You can run the query to test the condition from this section.
-
Notifications: Indicate which users or notification destinations should be alerted when the threshold value falls outside of the expected range.
-
Advanced: Use advanced settings to alert on special values and conditions.
During the Public Preview period, alerts do not support queries with parameters. See What are legacy alerts?.
Use the following steps to create an alert:
-
Click
Alerts in the sidebar and click Create Alert.
-
Copy and paste the following query in the query editor. Click Run all (1000). To learn more about working with the SQL editor, see Write queries and explore data in the new SQL editor.
SQLSELECT
to_date(tpep_pickup_datetime) as date,
SUM(fare_amount) as amount
FROM
`samples`.`nyctaxi`.`trips`
GROUP BY
ALL
ORDER BY
1 DESC -
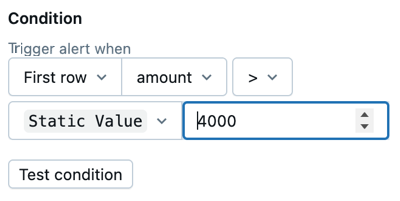
In the Condition field, set the conditions that should trigger the alert.

Apply the following settings as shown:
- Select Sum as the data value to check. Alert conditions can be set on the first value of a column in the query result, or you can choose to set an aggregation across all the rows of a single column, such as SUM or AVERAGE.
- Select amount as the column to check.
- Select > (greater than) as the logical operator to apply.
- Set the threshold value to
Static value4000. Static value is selected by default. Enter 4000 into the value field.
-
Click Test condition to preview the alert and test whether the alert would trigger with the current data. The provided settings should trigger the alert. You can change the threshold value to test further.
-
In the Notifications section, search for your user name and click on it when it appears.
-
Click
the calendar icon to open the Edit schedule dialog. Use the drop-down menus to set the alert so that it runs Every 5 minutes from 0 minutes past the hour. Click Save. Optionally, select the Show cron syntax checkbox to edit the schedule in Quartz Cron Syntax.
-
Click View alert.
Your alert is saved and runs on the schedule you provided. The data used in this example is static, so if your Test condition returned as Triggered, it will again the next time it runs. You receive an email notification as an alert. If the Test condition returned OK, no notification is sent.
Review alert details
A page opens to show your alert details. Additionally, an alert history is shown with evaluation history details. Click the Run now button to run the alert query immediately and return the result on this screen.
Click Edit in the top right corner of the page to continue editing the alert.
Advanced settings
Click Advanced settings to apply the following settings:
- Notify on ok: Send a notification when the alert returns as
OK. - Notification frequency: Periodically send notifications on an alert until the status returns to
OK. - Empty result state: Set a special status to return when the query returns no results.
- Template: You can choose to send notifications using the default template or a custom template. The following list explains each template type:
- Use default template: Alert notification is a message with links to the Alert configuration screen and the Query screen.
- Use custom template: Alert notification includes more specific information about the alert.
-
A box displays, consisting of input fields for subject and body. Any static content is valid, and you can incorporate built-in template variables:
ALERT_STATUS: The evaluated alert status (string).ALERT_CONDITION: The alert condition operator (string).ALERT_THRESHOLD: The alert threshold (string or number).ALERT_COLUMN: The alert column name (string).ALERT_NAME: The alert name (string).ALERT_URL: The alert page URL (string).QUERY_RESULT_TABLE: The query result HTML table (string). Results are limited to the first 100 rows. Only email notification destinations can render HTML.QUERY_RESULT_VALUE: The query result value (string or number).QUERY_RESULT_ROWS: The query result rows (value array).QUERY_RESULT_COLS: The query result columns (string array).
An example subject, for instance, could be:
Alert "{{ALERT_NAME}}" changed status to {{ALERT_STATUS}}. -
You can use HTML to format messages in a custom template. Only email notification destinations can render HTML. The following tags and attributes are allowed in templates:
-
Allowed tags:
<a>,<b>,<blockquote>,<br>,<code>,<del>,<div>,<em>,<h1>,<h2>,<h3>,<h4>,<h5>,<h6>,<hr>,<i>,<img>,<li>,<ol>,<p>,<pre>,<span>,<table>,<thread>,<tbody>,<td>,<th>,<tr>,<u>,<ul> -
Allowed attributes:
Attribute
Supported tags
href<a>title<img>target<a>alt<img>src<img>start<b>,<blockquote>,<code>,<del>,<em>,<hr>,<i>,<pre>,<u>
-
-
Click the Preview toggle button to preview the rendered result.
importantThe preview is useful for verifying that template variables are rendered correctly. It is not an accurate representation of the eventual notification content, as each notification destination can display notifications differently.
-
Workspace admins can set up new notification destinations. See Manage notification destinations.
Alert aggregations
An aggregation on an alert works by modifying the original SQL of the Databricks SQL query attached to the alert. The alert wraps the original query text in a common table expression (CTE) and performs a wrapping aggregation query on it to aggregate the query result.
As an example, a SUM aggregation on an alert attached to a query with text SELECT 1 AS column_name means that whenever the alert is refreshed, the modified SQL that runs would be: WITH q AS (SELECT 1 AS column_name) SELECT SUM(column_name) FROM q.
This means that the original query result (pre-aggregated) cannot be shown in an alert custom body (with parameters such as QUERY_RESULT_ROWS and QUERY_RESULT_COLS) whenever there is an aggregation on an alert. Instead, those variables will only display the final, post-aggregation query result.
Alert on multiple columns
To set an alert based on multiple columns of a query, your query can implement the alert logic and return a boolean value for the alert to trigger on. For example:
SELECT CASE WHEN drafts_count > 10000 AND archived_count > 5000 THEN 1 ELSE 0 END
FROM (
SELECT sum(CASE WHEN is_archived THEN 1 ELSE 0 END) AS archived_count,
sum(CASE WHEN is_draft THEN 1 ELSE 0 END) AS drafts_count
FROM queries) data
This query returns 1 when drafts_count > 10000 and archived_count > 5000.
Then you can configure the alert to trigger when the value is 1.
Alert on metric views
Because metric views are designed to track and measure core business metrics, they pair well with alerts so that you can be automatically notified when a metric falls outside of an expected range. Alerts on metric views work in the same way as an alert on any other dataset. When you write the query to configure the query, use the fully qualified name of the metric view you want to monitor.
How Git integration works with alerts
You can use Databricks Git folders to track and manage changes to alerts. To track alerts with Git, place them in a Databricks Git folder. Newly cloned alerts only appear in the alerts list page or API after a user interacts with them. They have paused schedules and need to be explicitly resumed by users.
Databricks Git folders provide a centralized way to manage common Git operations for alerts and other workspace objects. To learn more, see Databricks Git folders.
Differences from legacy alerts
The latest version of Databricks SQL alerts behaves differently from legacy alerts in a few key ways:
- Jobs integration: You can use a SQL alert task to evaluate alerts as part of a Lakeflow Jobs pipeline. This feature is in Beta. To learn more, see SQL alert task for jobs.
- Query reuse: An existing saved SQL query cannot be reused when creating an alert. Each alert owns its query definition, which can be authored directly in the new alert editor.
- Alert status values: Alert states are simplified and alerts no longer support the
UNKNOWNstatus from legacy alerts. Evaluations resolve toOK,TRIGGERED, orERROR.
You can continue to use both the latest alerts and legacy alerts side by side while you transition.
Configure alert permissions and transfer alert ownership
For alert permission levels, see Alerts ACLs.
-
In the sidebar, click Alerts.
-
Click an alert.
-
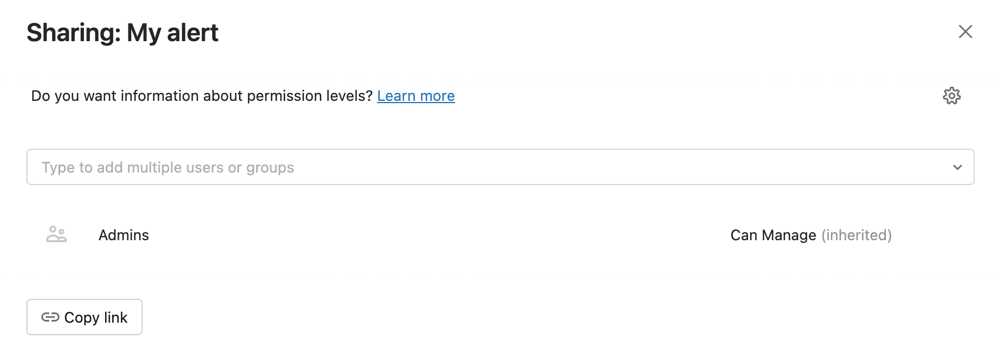
Click Share in the upper-right corner of the alert detail page to open the Sharing dialog.

-
Search for and select the groups and users, and assign the permission level.
-
Click Add.
Transfer ownership of an alert
When you save an alert, you become the alert's owner. If an alert's owner is removed from a workspace, the alert no longer has an owner. A workspace admin user can transfer ownership of an alert to a different user. You can also transfer ownership using the Permissions API.
-
As a workspace admin, log in to your Databricks workspace.
-
In the sidebar, click Alerts.
-
Click an alert.
-
Click the Share button at the top right to open the Sharing dialog.
-
Click on the gear icon at the top right and click Assign new owner.

-
Select the user to assign ownership to.
-
Click Confirm.