Query history
If your workspace is enabled for serverless compute, your query history also contains all SQL and Python queries run on serverless compute for notebooks and jobs. See Connect to serverless compute.
You can use the information available through this screen to help you debug issues with queries.
This section describes how to work with query history using the UI. To work with query history using the API, see Query History.
View query history
You can view previous query runs if you are the query owner. Other users can view query runs if they have at least CAN VIEW access to the SQL warehouse that executed the query.
To view previous runs for a query:
- Click
 Query History in the sidebar.
 - Optionally, use the filters near the top of the page to filter the list by user, date range, compute, duration, query status, statement type, statement ID, and query tags.
Databricks SQL queries shared by a user with Run as Owner permissions to another user with CAN RUN permissions appear in the query history of the user executing the query and not the user that shared the query.
View query details
To view details about a query, such as the complete query statement, query source, duration, number of rows returned, and I/O performance, or execution details.
-
Access the query history as outlined in the previous section.
-
Click the query text you want to view. A summary panel opens to the right.
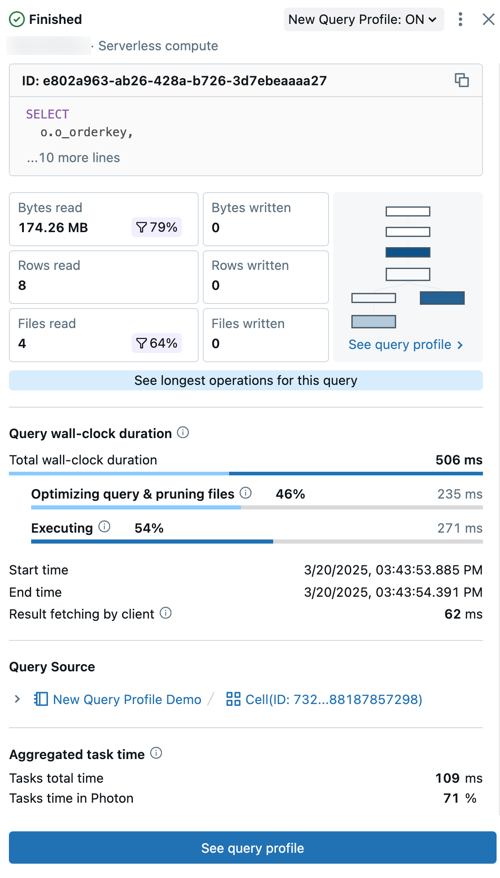
- Query status: The query is tagged with its current status: Queued, Running, Finished, Failed, or Cancelled.
- User and compute details: See the username, compute type, and runtime details for this query run.
- ID: This is the universally unique identifier (UUID) associated with the given query execution.
- Query statement: This section includes the complete query statement. If the query is too long to be shown in the preview, click ... more lines to view the full text.
- Query metrics: Popular metrics for query analysis are shown under the query text. The filter icons that appear with some metrics indicate the percent of data pruned during scanning.
- See query profile: A preview the query profile directed acyclic graph (DAG) is shown in this summary. This can be helpful for quickly estimating query complexity and execution flow. Click See query profile to open the detailed DAG.
- See longest operators for this query: Click this button to open the Top operators panel. This panel shows the longest running operators in the query.
- Query wall-clock duration: The total elasped time between the start of scheduling and the end of the query execution is provided as a summary. A detailed breakdown of scheduling, query optimization and file pruning, and execution time appears below the summary.
- Query source: Click on the name of the listed object to go to the query source.
- Aggregated task time: View the combined time it took to execute the query across all cores of all nodes. It can be significantly longer than the wall-clock duration if multiple tasks are excuted in parallel. It can be shorter than the wall-clock duration if tasks waited for available nodes.
- Input/Output (IO): View details about the data read and written during the query execution.
-
For more detailed information about the query's performance, including its execution plan, click View Query Profile near the bottom of the page. For more details, see Query profile.
Terminate an executing query
To terminate a long-running query started by you or another user:
-
Access the query history as outlined in the previous section.
-
Click the query text.
-
Next to Status, click Cancel.
noteCancel only appears when a query is running.
The query is terminated, and its status changes to Canceled.
Statements that use Lakeflow pipelines compute can only be canceled from the Pipelines UI.
Access the query history system table
Databricks system tables include a query history table (system.query.history) where privileged users can view tabular query history records from across your account. By default, only admins have access to your account's system tables. For information on enabling and accessing the query history system table, see Query history system table reference.