Query profile
You can use a query profile to visualize the details of a query execution. The query profile helps you troubleshoot performance bottlenecks during the query's execution. For example:
- You can visualize each query operator and related metrics, such as the time spent, number of rows processed, rows processed, and memory consumption.
- You can identify the slowest part of a query execution at a glance and assess the impacts of modifications to the query.
- You can discover and fix common mistakes in SQL statements, such as exploding joins or full table scans.
Requirements
To view a query profile, you must either be the owner of the query or you must have at least CAN MONITOR permission on the SQL warehouse that executed the query.
View a query profile
You can view the query profile from the query history using the following steps:
-
Click
 Query History in the sidebar.
 -
Click the name of a query. A query details panel appears on the right side of the screen.
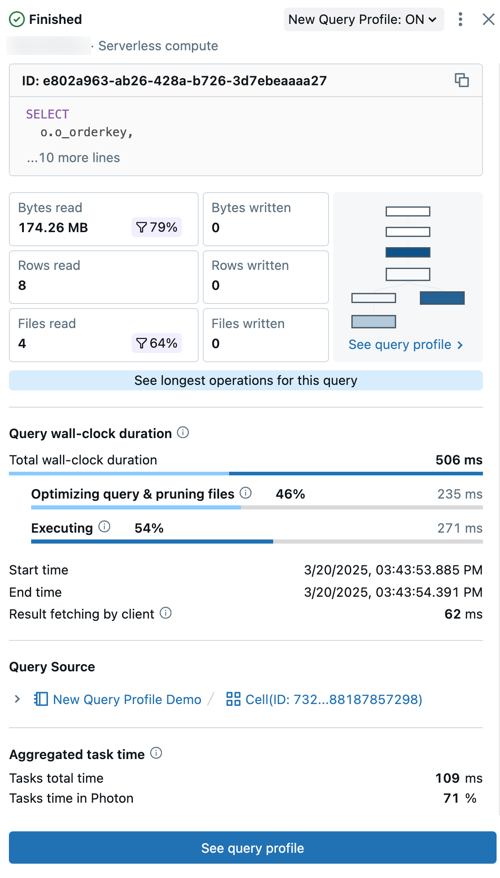
The query summary includes:
- Query status: The query is tagged with its current status: Queued, Running, Finished, Failed, or Cancelled.
- User and compute details: See the username, compute type, and runtime details for this query run.
- ID: This is the universally unique identifier (UUID) associated with the given query execution.
- Query statement: This section includes the complete query statement. If the query is too long to be shown in the preview, click ... more lines to view the full text.
- Query metrics: Popular metrics for query analysis are shown under the query text. The filter icons that appear with some metrics indicate the percent of data pruned during scanning.
- See query profile: A preview of the query profile directed acyclic graph (DAG) is shown in this summary. This can be helpful for quickly estimating query complexity and execution flow. Click See query profile to open the detailed DAG.
- See longest operators for this query: Click this button to open the Top operators panel. This panel shows the longest running operators in the query.
- Query wall-clock duration: The total elapsed time between the start of scheduling and the end of the query execution is provided as a summary. A detailed breakdown of scheduling, query optimization and file pruning, and execution time appears below the summary.
- Query source: Click on the name of the listed object to go to the query source.
- Aggregated task time: View the combined time it took to execute the query across all cores of all nodes. It can be significantly longer than the wall-clock duration if multiple tasks are excuted in parallel. It can be shorter than the wall-clock duration if tasks waited for available nodes.
- Input/Output (IO): View details about the data read and written during the query execution.
-
Click See query profile. A Details panel opens on the right side of the screen.
 note
noteIf Query profile is not available is displayed, no profile is available for this query. A query profile is not available for queries that run from the query cache. To circumvent the query cache, make a trivial change to the query, such as changing or removing the
LIMIT.
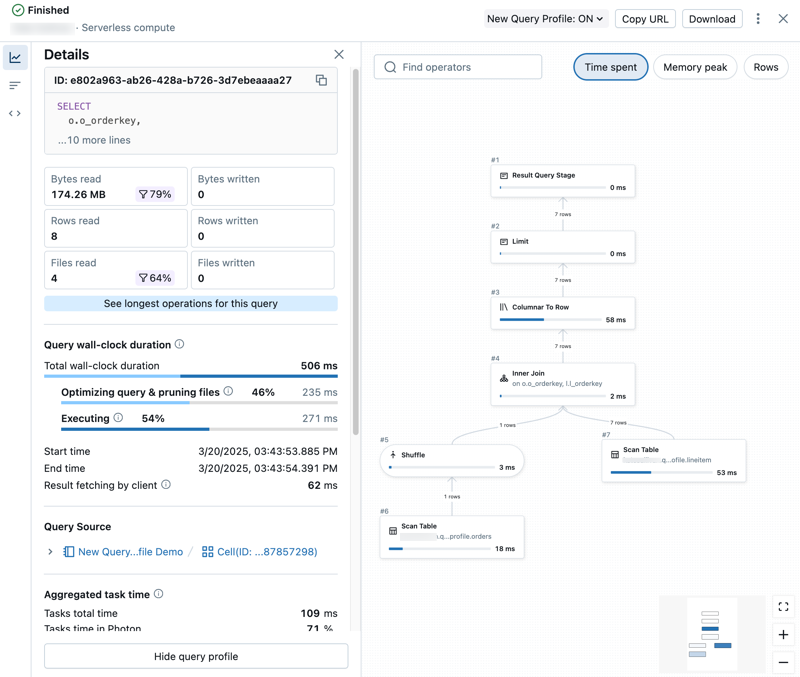
View query profile details
The detailed query profile includes summary metrics on the left side of the panel and a graph view of operators on the right.
Explore query metrics
The left side of the query profile has the following tabs:
-
 Details: Opens the Details panel which shows query summary metrics.
 -
Top operators: Opens the Top operators panel which shows the most expensive operators used in your query. This can be useful for identifying optimization opportunities.
-
 Query text: Opens the Query text panel which shows the full text of the query.
Some non-Photon operations are executed as a group and share common metrics. In this case, all operations have the same value as the parent operator for a given metric.
Explore the DAG
The right half of the query profile shows the directed acyclic graph (DAG) of the query. The graph view shows metrics such as Time spent, Memory peak, and Rows. Click on each metric to change the reporting metric shown.
You can interact with the DAG in the following ways:
- Use the search bar to highlight different operators or columns.
- Zoom in or out focus on different parts of the DAG.
- Click on operators to show detailed metrics and descriptions. A panel on the right side of the graph shows operation details.
For Databricks SQL queries, you can also view the query profile in the Spark UI. Click the ![]() kebab menu near the top of the page, then click Open in Spark UI.
kebab menu near the top of the page, then click Open in Spark UI.
By default, metrics for some operations are hidden. These operations are unlikely to be the cause of performance bottlenecks. To see information for all operations, and to see additional metrics, click ![]() at the top of the page, then click Enable verbose mode.
at the top of the page, then click Enable verbose mode.
Common operations
The most common operations are:
- Scan: Data was read from a datasource and output as rows.
- Join: Rows from multiple relations were combined (interleaved) into a single set of rows.
- Union: Rows from multiple relations that use the same schema were concatenated into a single set of rows.
- Shuffle: Data was redistributed or repartitioned. Shuffle operations are expensive with regard to resources because they move data between executors on the cluster.
- Hash / Sort: Rows were grouped by a key and evaluated using an aggregate function such as
SUM,COUNT, orMAXwithin each group. - Filter: Input is filtered according to a criteria, such as by a
WHEREclause, and a subset of rows is returned.
Performance insights
This feature is in Beta. Workspace admins can control access to this feature from the Previews page. See Manage Databricks previews.
When queries run, Databricks might return performance insights that identify opportunities to improve query performance. The query profile surfaces insights in two places:
- The query details panel shows a summary of the most impactful insights, ranked by their projected effect on total task duration.
- The Performance insights tab in the detailed query profile shows the full detail for each insight.
For the list of supported insights and their meaning, see Query performance insights.
Optimize with Genie Code
When a query has insights that you can act on, select Optimize to open Genie Code. For an insight that requires a query change, Genie Code rewrites the query and presents the changes for your approval. For an insight that involves table or compute changes, Genie Code summarizes the recommended actions as plain-language text.
To learn more about working with Genie Code, see Genie Code.
Share a query profile
To share a query profile with another user:
- View query history.
- Click the name of the query.
- To share the query, you have two choices:
- If the other user has the CAN MANAGE permission on the query, you can share the URL for the query profile with them. Click Share. The URL is copied to your clipboard.
- Otherwise, if the other user does not have the CAN MANAGE permission or is not a member of the workspace, you can download the query profile as a JSON object. Download. The JSON file is downloaded to your local system.
Import a query profile
To import the JSON for a query profile:
-
View query history.
-
Click the kebab menu
 on the upper right, and select Import query profile (JSON).
 -
In the file browser, select the JSON file that was shared with you and click Open. The JSON file is uploaded and the query profile is displayed.
When you import a query profile, it is dynamically loaded into your browser session and does not persist in your workspace. You need to re-import it each time you want to view it.
-
To close the imported query profile, click X at the top of the page.
Access the query profile
You can also access the query profile in the following parts of the UI:
-
From the SQL editor: During and after query execution, a link near the bottom of the page displays the time elapsed and number of rows returned. Click that link to open the query details panel. Click See query profile.
 note
noteIf you have the new SQL editor enabled (Public Preview), your link appears as it does in a notebook.
-
From a notebook: If your notebook is attached to a SQL warehouse or serverless compute, you can access the query profile using the link under the cell that contains the query. Click See performance to open the run history. Click a statement to open the query details panel.

-
From the Lakeflow pipelines UI: You can access the query history and profile from the Query History tab in the pipeline UI. See Access query history for pipelines.
-
From the jobs UI: You can access query profiles for jobs run on SQL warehouses and serverless compute. For jobs run on serverless compute, see View query details for job runs to learn how to view query details in the jobs UI.
Next steps
- Learn about accessing query metrics using the query history API
- Learn more about query history