MLflow system tables reference
The MLflow system tables are in Public Preview.
The mlflow system tables capture experiment metadata managed within the MLflow tracking service. These tables allow privileged users to take advantage of Databricks lakehouse tooling on their MLflow data across all workspaces within the region. You can use the tables to build custom AI/BI dashboards, set up SQL alerts, or perform large-scale analytical queries.
Through the mlflow system tables, users can answer questions like:
- Which experiments have the lowest reliability?
- What is the average GPU utilization across different experiments?
The mlflow system tables began recording MLflow data from all regions on September 2, 2025. Data from before that date may not be available.
Available tables
The mlflow schema includes the following tables:
system.mlflow.experiments_latest: Records experiment names and soft-deletion events. This data is similar to the experiments page in the MLflow UI.system.mlflow.runs_latest: Records run-lifecycle information, the params and tags associated with each run, and aggregated stats of min, max, and latest values of all metrics. This data is similar to the runs search or runs detail page.system.mlflow.run_metrics_history: Records the name, value, timestamp, and step of all metrics logged on runs, which can be used to plot detailed timeseries from runs. This data is similar to the metrics tab on the runs detail page.
The following is an example of plotting run information using a dashboard:
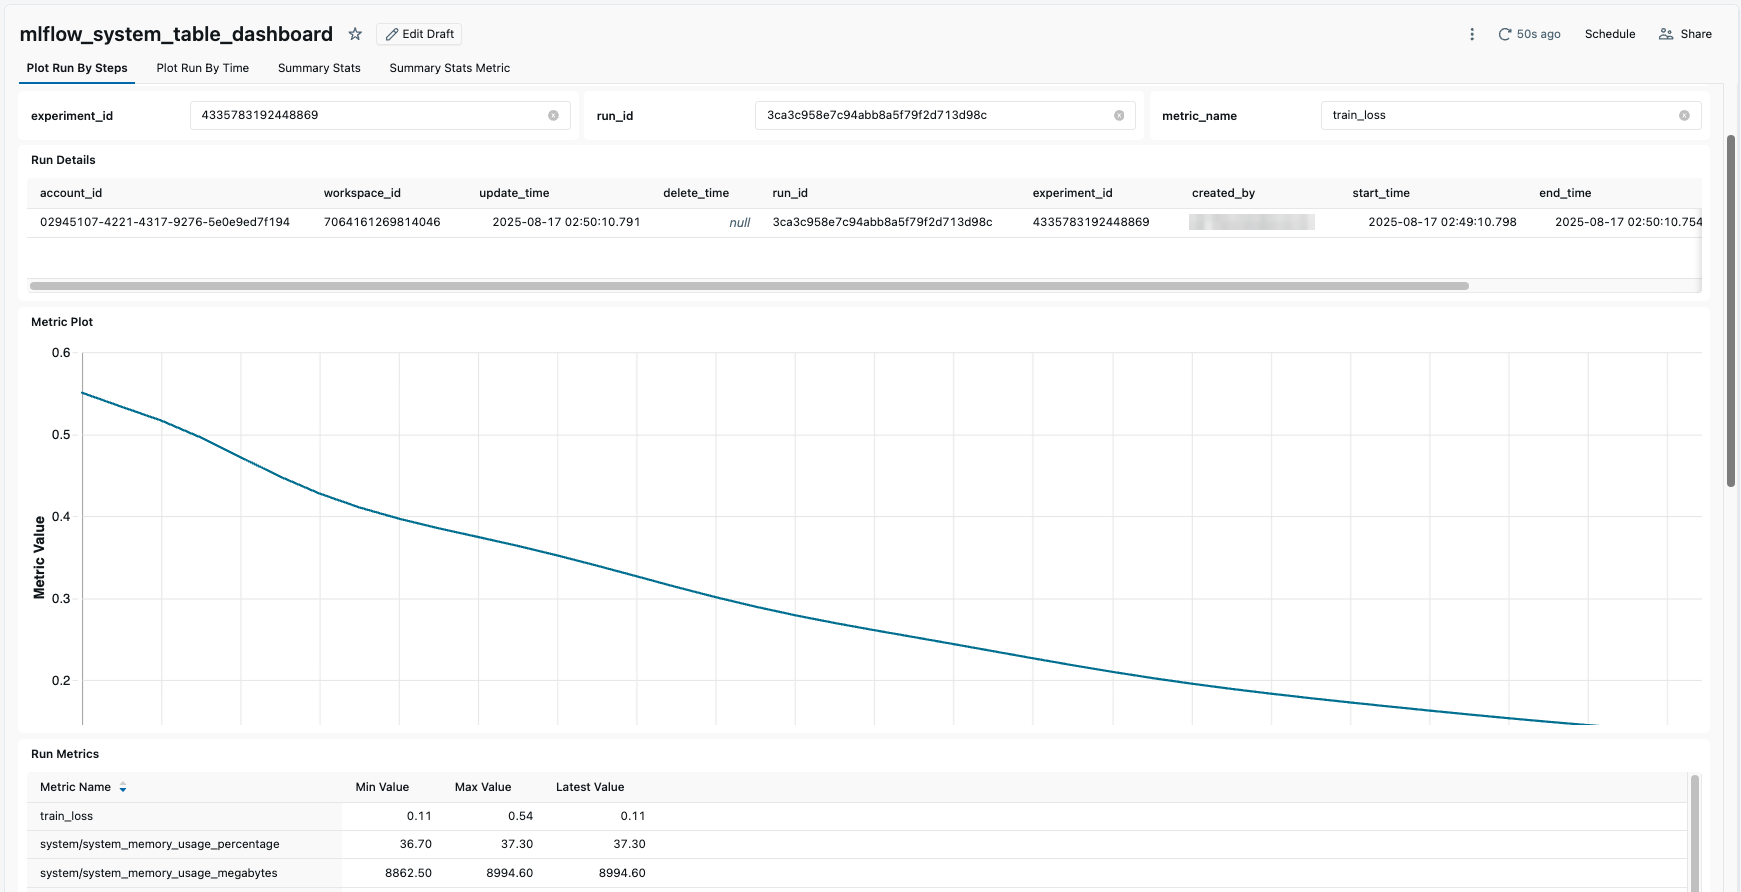
Table schemas
Below are the table schemas with descriptions and example data.

system.mlflow.experiments_latest
Column name | Data type | Description | Example | Nullable |
|---|---|---|---|---|
| string | The ID of the account containing the MLflow experiment |
| No |
| timestamp | The system time when the experiment was last updated |
| No |
| timestamp | The system time when the MLflow experiment was soft-deleted by the user |
| Yes |
| string | The ID of the MLflow experiment |
| No |
| string | The ID of the workspace containing the MLflow experiment |
| No |
| string | User-provided name of the experiment |
| No |
| timestamp | The system time when the experiment was created |
| No |
system.mlflow.runs_latest
Column name | Data type | Description | Example | Nullable |
|---|---|---|---|---|
| string | The ID of the account containing the MLflow run |
| No |
| timestamp | The system time when the run was last updated |
| No |
| timestamp | The system time when the MLflow run was soft-deleted by the user |
| Yes |
| string | The ID of the workspace containing the MLflow run |
| No |
| string | The ID of the MLflow run |
| No |
| string | The ID of the MLflow experiment containing the MLflow run |
| No |
| string | The name of the Databricks principal, user, or group that created the MLflow run |
| Yes |
| timestamp | The user-specified time when the MLflow run started |
| No |
| timestamp | The user-specified time when the MLflow run ended |
| Yes |
| string | The name of the MLflow run |
| No |
| string | The execution status of the MLflow run |
| No |
| map<string, string> | Key-value parameters of the MLflow run |
| No |
| map<string, string> | Key-value tags set on the MLflow run |
| No |
| list<struct<string, double, double, double>> | An aggregated view summarizing the metrics in the run_metrics_history |
| No |
| string | The user-specified name of the metric |
| No |
| double | The latest value of the metric_name in the time series of this (run, metric_name) combination in run_metrics_history |
| No |
| double | The maximum value of the metric_name in the time series of this (run, metric_name) combination in run_metrics_history. If any NaN value was recorded for a metric, the value will be NaN |
| No |
| double | The minimum value of the metric_name in the time series of this (run, metric_name) combination in run_metrics_history. If any NaN value was recorded for a metric, the value will be NaN |
| No |
system.mlflow.run_metrics_history
Column name | Data type | Description | Example | Nullable |
|---|---|---|---|---|
| string | The ID of the account containing the MLflow run to which the metric was logged |
| No |
| timestamp | The system time when the metric was inserted |
| No |
| string | A unique identifier of the metric to distinguish between identical values |
| No |
| string | The ID of the workspace containing the MLflow run to which the metric was logged |
| No |
| string | The ID of the MLflow experiment containing the MLflow run to which the metric was logged |
| No |
| string | The ID of the MLflow run to which the metric was logged |
| No |
| string | The metric name |
| No |
| timestamp | The user-specified time when the metric was computed |
| No |
| bigint | The step (for example, epoch) of model training or agent development at which the metric was logged |
| No |
| double | The metric value |
| No |
Sharing access with users
By default, only account admins have access to system schemas. To give additional users access to the tables, an account admin must grant them the USE and SELECT permissions on the system.mlflow. schema. See Unity Catalog privileges reference.
Any user who has access to these tables can view metadata across all MLflow experiments for all workspaces in the account. To configure table access for a given group rather than individual users, see Unity Catalog best practices.
If you require finer-grained control than granting all users access to the table, you can use dynamic views with custom criteria to grant groups certain access. For example, you could create a view that only shows records from a particular set of experiment IDs. After configuring a custom view, give the name of the view to your users so that they can query the dynamic view rather than the system table directly.
You cannot directly sync MLflow experiment permissions with Unity Catalog permissions.
Example use cases of MLflow metadata
The following sections give examples of how you can use the MLflow system tables to answer questions about your MLflow experiments and runs.
Configure a SQL alert for low experiment reliability
Using Databricks SQL alerts, you can schedule a regularly recurring query and be notified if certain constraints are no longer met.
This example creates an alert that examines the most frequently run experiments within your workspace to determine whether they are experiencing low reliability and may need special attention. The query uses the runs_latest table to calculate the runs per experiment that are marked as finished, divided by the total number of runs.
You can also use legacy alerts.
-
Click
 Alerts in the sidebar and click Create Alert.
 -
Copy and paste the following query in the query editor.
SQLSELECT
experiment_id,
AVG(CASE WHEN status = 'FINISHED' THEN 1.0 ELSE 0.0 END) AS success_ratio,
COUNT(status) AS run_count
FROM system.mlflow.runs_latest
WHERE status IS NOT NULL
GROUP BY experiment_id
ORDER BY run_count DESC
LIMIT 20; -
In the Condition field, set the conditions to
MIN success_ratio < 0.9. This will trigger the alert if any of the top 20 experiments (by number of runs) has a success ratio less than 90%.
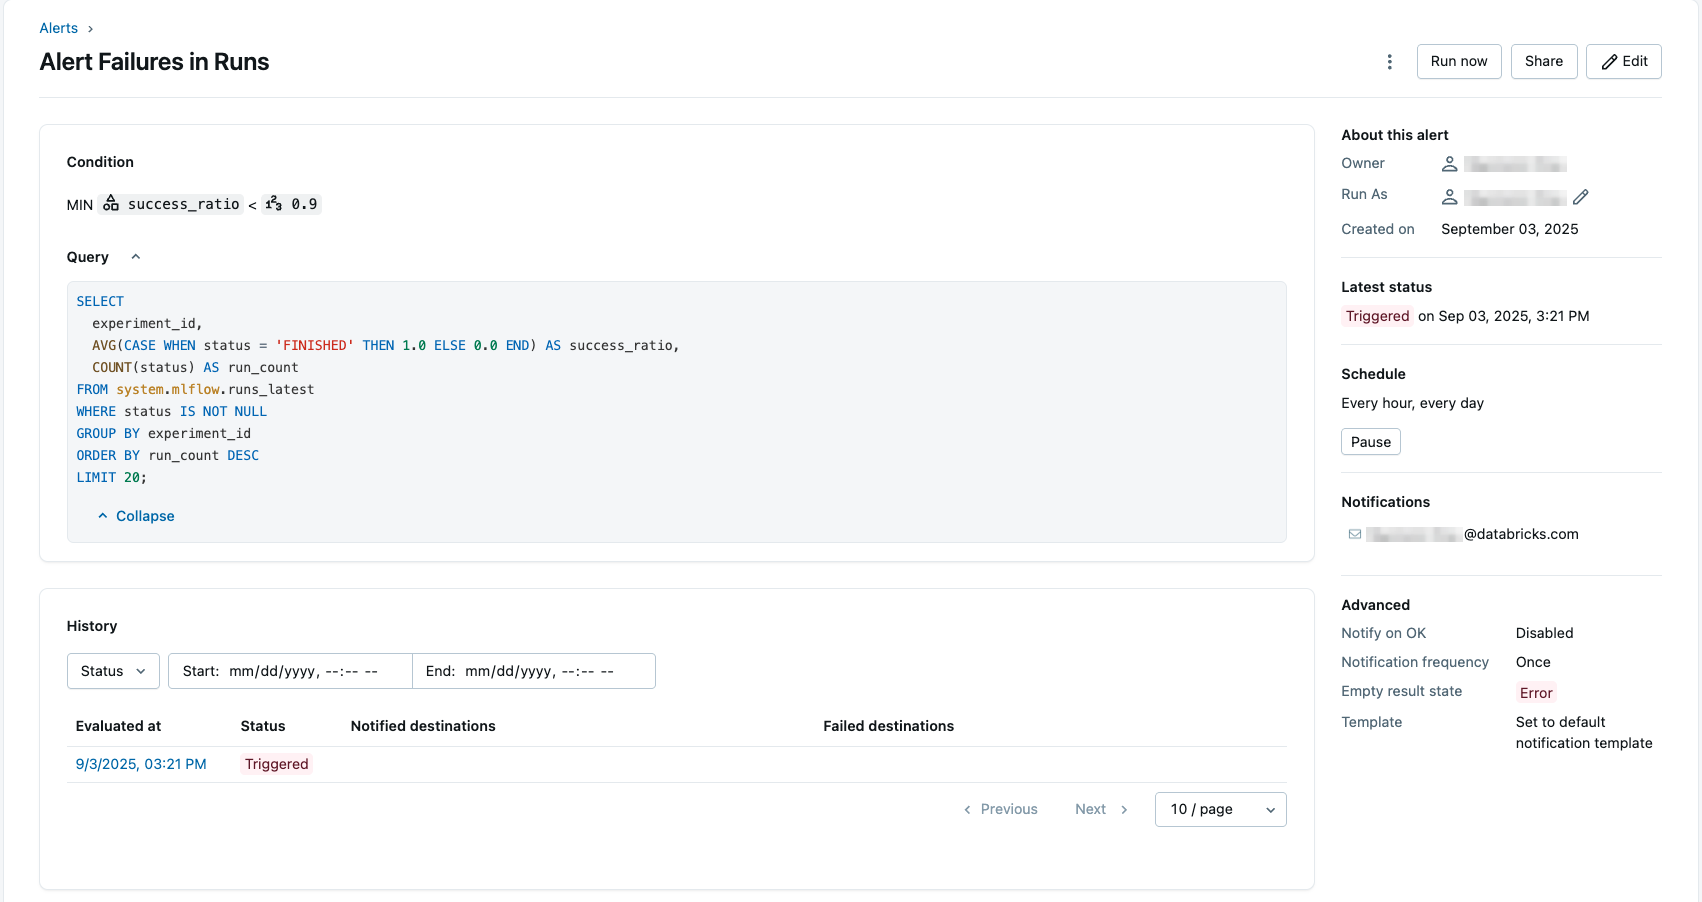
Additionally, you can test the condition, set a schedule, and configure notifications. For more information on configuring the alert, see setting up a SQL alert. Below is an example configuration using the query.
Sample queries
You can use the following sample queries to get information about MLflow activity in your account using Databricks SQL. You can also leverage tools like Python notebooks with Spark.
Get run information from runs_latest
SELECT
  run_name,
  date(start_time) AS start_date,
  status,
  TIMESTAMPDIFF(MINUTE, start_time, end_time) AS run_length_minutes
FROM system.mlflow.runs_latest
WHERE
  experiment_id = :experiment_id
  AND run_id = :run_id
LIMIT 1
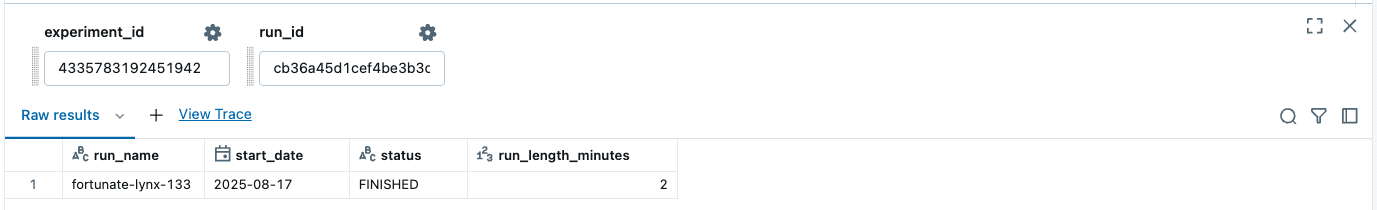
This returns information about the given run:
Get experiment and run information from experiments_latest and runs_latest
SELECT
  runs.run_name,
  experiments.name,
  date(runs.start_time) AS start_date,
  runs.status,
  TIMESTAMPDIFF(MINUTE, runs.start_time, runs.end_time) AS run_length_minutes
FROM system.mlflow.runs_latest runs
  JOIN system.mlflow.experiments_latest experiments ON runs.experiment_id = experiments.experiment_id
  WHERE
    runs.experiment_id = :experiment_id
    AND runs.run_id = :run_id
LIMIT 1
Get summary statistics for a given run from run_metrics_history
SELECT
  metric_name,
  count(metric_time) AS num_data_points,
  ROUND(avg(metric_value), 1) AS avg,
  ROUND(max(metric_value), 1) AS max,
  ROUND(min(metric_value), 1) AS min,
  ROUND(PERCENTILE_CONT(0.25) WITHIN GROUP (ORDER BY metric_value), 1) AS pct_25,
  ROUND(PERCENTILE_CONT(0.5) WITHIN GROUP (ORDER BY metric_value), 1) AS median,
  ROUND(PERCENTILE_CONT(0.75) WITHIN GROUP (ORDER BY metric_value), 1) AS pct_75
FROM
  system.mlflow.run_metrics_history
WHERE
  run_id = :run_id
GROUP BY
  metric_name, run_id
LIMIT 100
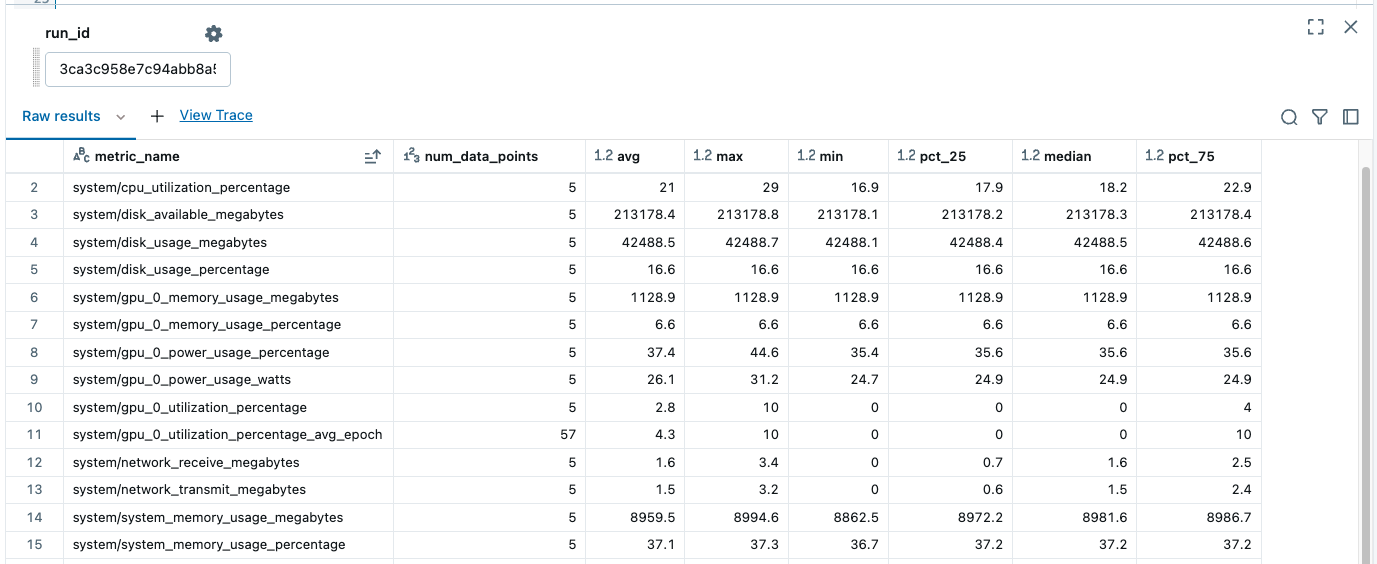
This returns a summary of the metrics for the given run_id:
Dashboards for experiments and runs
You can build dashboards on top of MLflow system tables data to analyze your MLflow experiments and runs from the entire workspace.
For more details, see Build dashboards with MLflow metadata in system tables