Monitor coding agent activity
Monitor your team's coding agents in Unity Gateway: coding-agent activity, model usage, and request traces. Start with the usage dashboard, then investigate individual requests and agent execution with tracing.
Usage dashboard
Open Unity Gateway > Govern > Usage Dashboard. The Coding Agents tab shows activity such as active days, coding sessions, commits, and lines of code added or removed. Use the dashboard's usage, performance, and cost views to investigate consumption and spending.
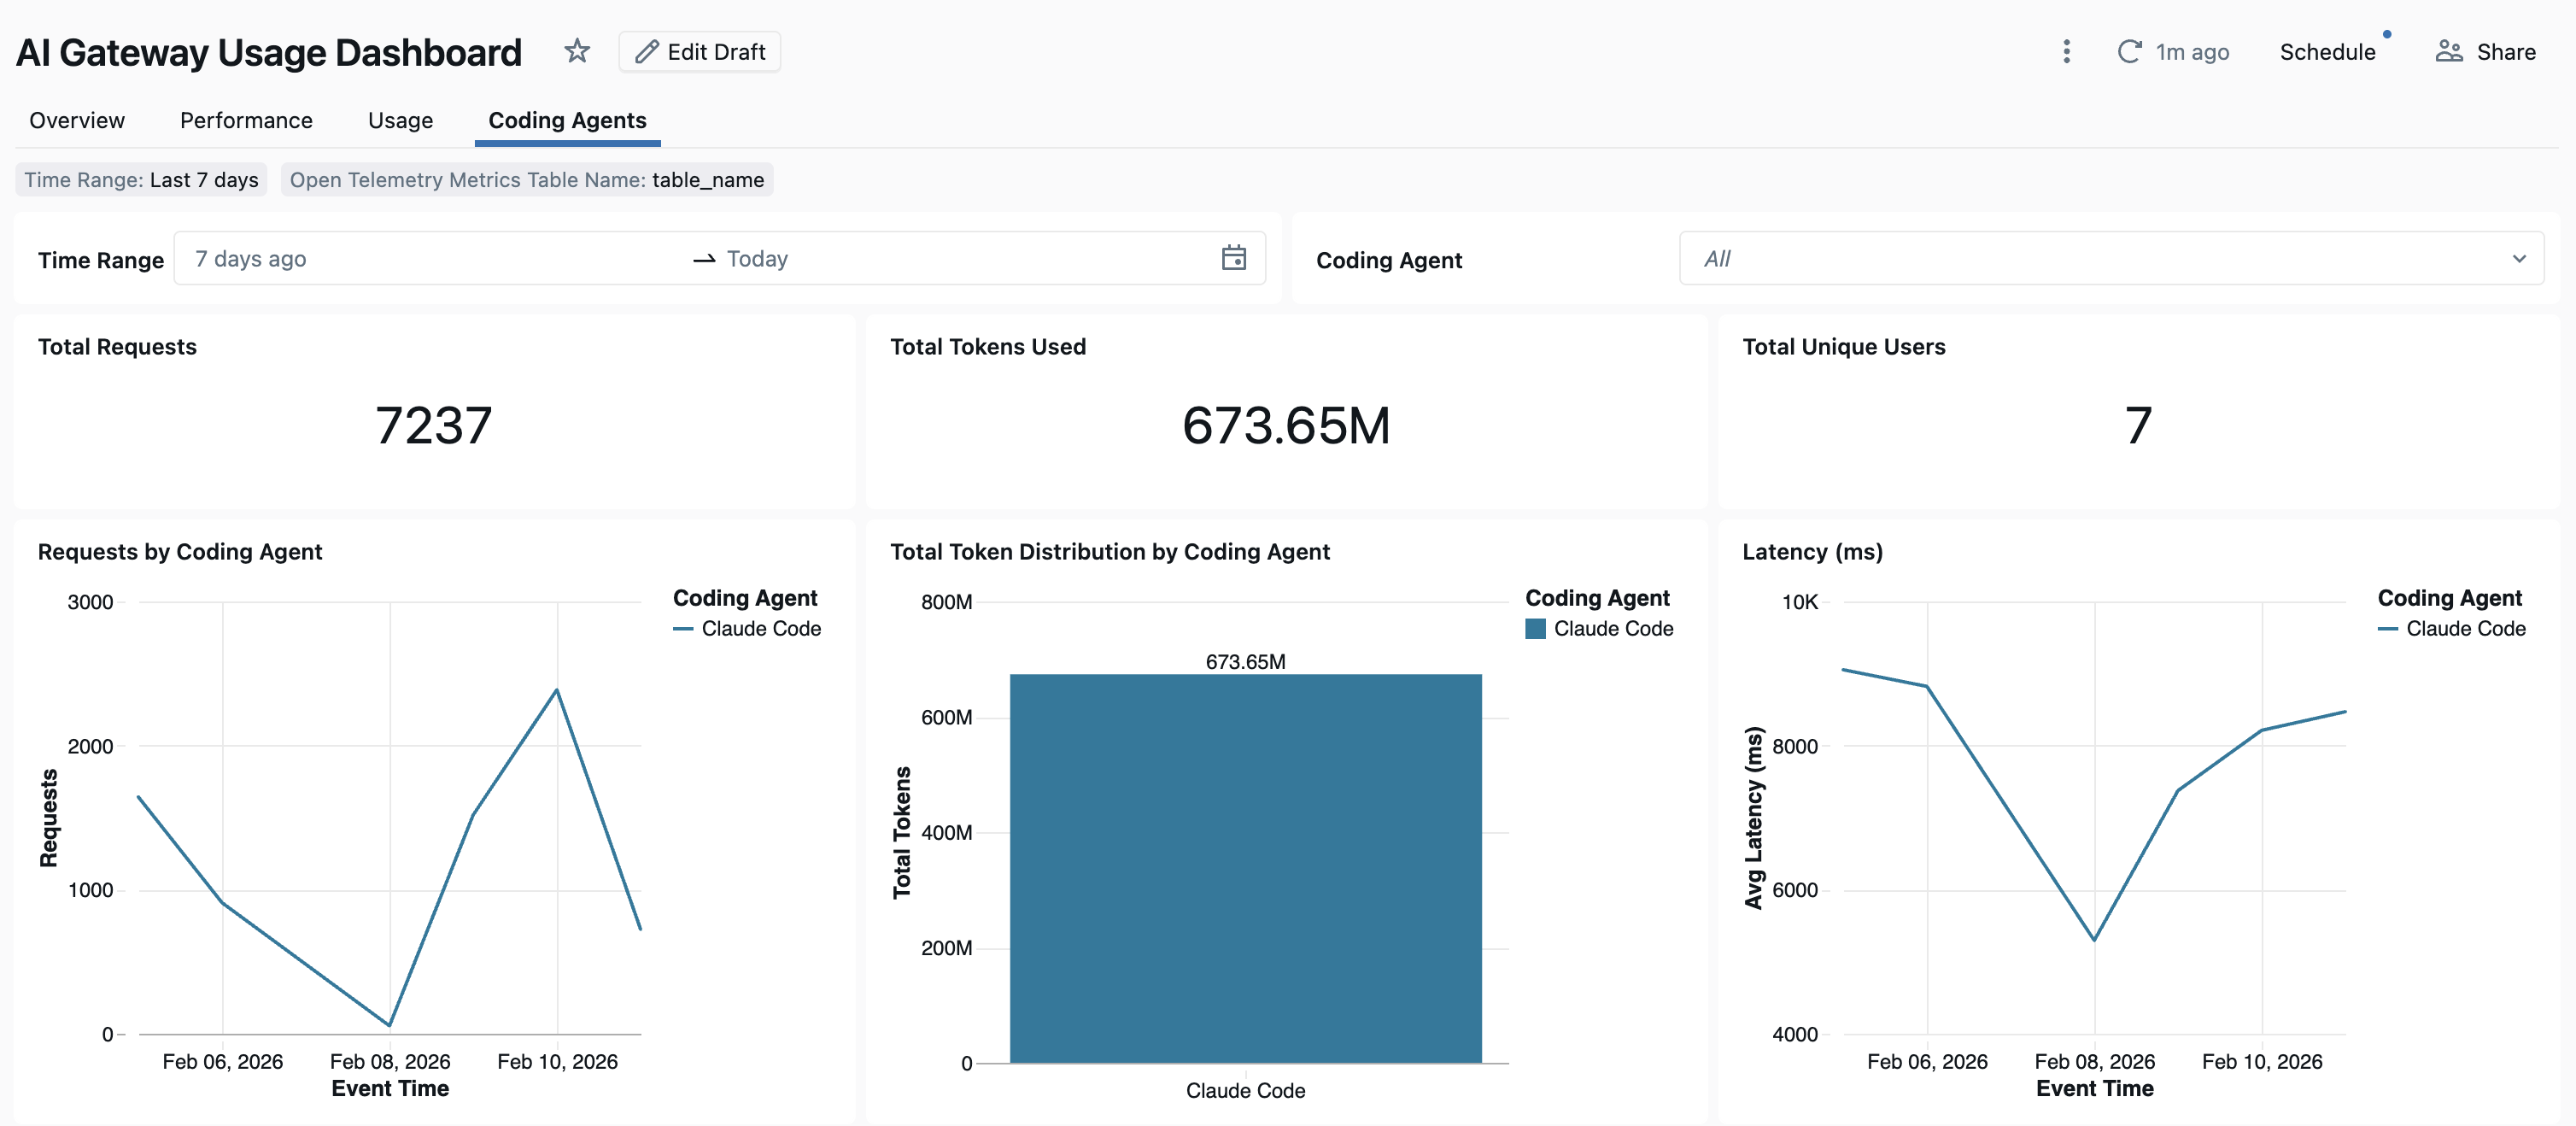
If a dashboard has not been created, an account admin can create it from Govern > Create Usage Dashboard. See Built-in usage dashboard.
Usage tracking
Query system.ai_gateway.usage to analyze model requests by user, model, or workspace, including token usage, latency, and errors. See Track model usage for access requirements and the table schema.
Tracing
The unified trace table is in Beta. An account admin must enable the Enhanced Unity Gateway preview from the account console Previews page. See Manage Databricks previews.
The unified trace table stores gateway request traces and client-side agent traces in the same Unity Catalog table:
- Gateway traces capture model and MCP requests handled by Unity Gateway. Collection starts when you enable unified tracing.
- Client-side traces capture activity emitted by the coding agent on the developer's machine. Enable them through the Unity Gateway CLI to add agent execution details to the same table.
Set up unified tracing
With the Enhanced Unity Gateway preview enabled, a metastore admin creates the trace table once for workspaces attached to the metastore:
- Open Unity Gateway > Govern > Traces and click Set up tracing.
- Select the catalog and schema for the trace table.
- Click Save.
Traces are stored at the Unity Catalog location selected during setup: <catalog>.<schema>.<table>. Open Govern > Traces to inspect them, or query the table in Databricks SQL. The table owner must grant access before other users can query it.
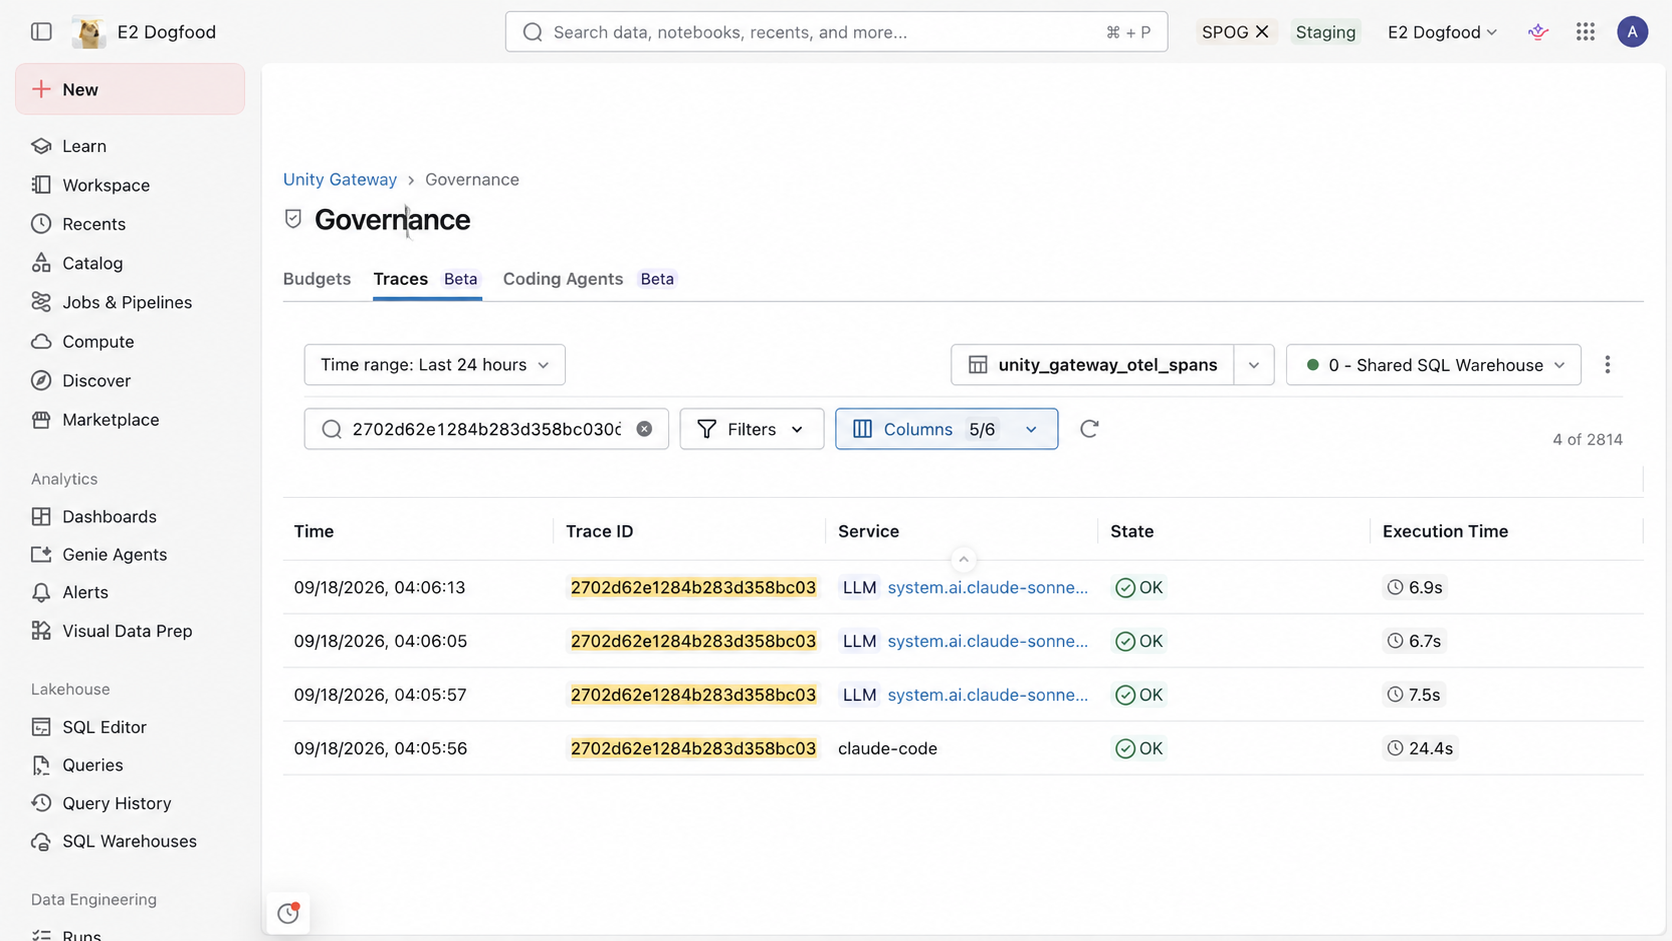
For access controls and query examples, see Monitor all AI activity using the unified trace table. For columns and span attributes, see the Unified trace table schema reference.
During Beta, the unified trace table has some limitations. See Limitations.
Enable client-side tracing
The Unity Gateway CLI configures Claude Code and Codex to send their traces to the unified trace table you set up above.
In your coding agent configuration, add the following setting inside each supported agent's existing config object, then publish the update:
{
  "tracing": {
    "enabled": true
  }
}
Developers launch the agent through ug claude or ug codex. The CLI applies the tracing setting and configures the export endpoint and authentication. To apply an update immediately, see Sync configuration updates.