Create a metric view
Catalog Explorer provides a visual interface for creating metric views. You define fields and measures interactively, without writing a YAML definition.
This page walks through building a metric view in the Catalog Explorer UI. For a more complex example with joins and advanced measures, see Tutorial: build a metric view with joins and data modeling.
Prerequisites
Before you create a metric view, verify that you have the following permissions:
SELECTprivileges on the table-like asset or SQL query used as the source.CREATE TABLEandUSE SCHEMAprivileges in the schema where you want to create the metric view.USE CATALOGprivilege on the parent catalog.CAN USEpermission on a SQL warehouse or other compute resource running Databricks Runtime 17.3 or above.
A metastore administrator or catalog owner can grant all of these privileges. A schema owner or user with MANAGE privilege can grant USE SCHEMA and CREATE TABLE privileges on the schema.
Create a metric view
Create a metric view in Catalog Explorer using one of the following methods:
- UI editor: on the UI tab, define fields and measures interactively, without writing code.
- YAML editor: click the
<>button to edit the definition directly. For the syntax, see Metric view YAML syntax reference. You can also use a YAML definition in a SQL statement to create a metric view. For the complete example in both YAML and SQL, see Define a metric view in SQL or YAML. - Genie Code: open Genie Code from the
 button in the upper-right corner and describe what you want in natural language. See Use Genie Code.
The following steps use the UI tab and the samples.tpch.orders table, available in every workspace, to build an example sales analytics metric view. The completed metric view matches the definition in Define a metric view in SQL or YAML. To learn more about this dataset, see Sample datasets.
Step 1: Create the metric view and open the editor
- Click
 Catalog in the workspace sidebar.
 - Use the search bar to find
samples.tpch.orders, then click the table name. - Click Create > Metric view. In the Create metric view dialog, enter a name, select a catalog and schema destination, then click Create.
The editor opens on the UI tab. The editor adds all source columns to the Fields tab automatically and adds a sample COUNT(*) measure.
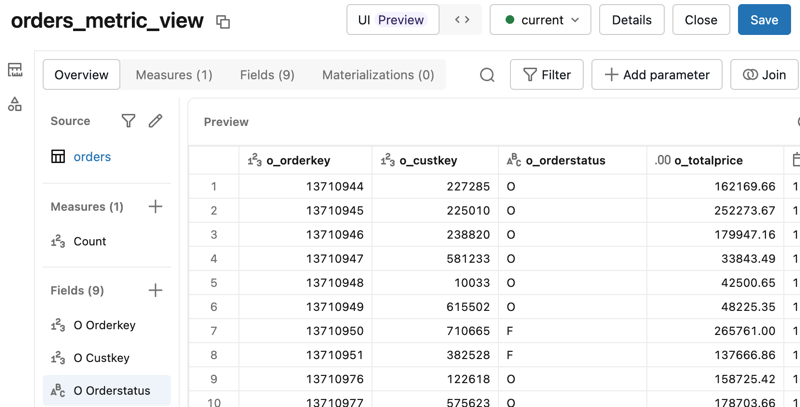
When you edit a field, you define its expression in one of two modes:
- Builder: In the Expression section, select from context-aware drop-downs, and the editor composes the SQL expression for you. The available choices change based on the column type and values.
- Custom: Enter the SQL expression directly.
The steps that follow switch between the two modes based on the complexity of each expression. Use Builder for simple column transforms and aggregations, and switch to Custom for expressions that Builder can't compose, such as CASE statements and composed measures.
Step 2: Add a join
The example joins the customer table so that customer attributes are available as fields. To add the join, click the join button in the upper-right corner of the editor:
- For the source to join, select
samples.tpch.customerand click Add. - Enter
customeras the Join name. - Use the drop-downs to set the join condition to
o_custkey = c_custkey. To add more than one join column, click + Join Key. To set a condition other than equality, click Expression and refine the condition. - Under Join Cardinality, select Many-to-one. For guidance on choosing a cardinality, see Join cardinality.
- Select At most one match under query performance. Each order matches at most one customer, so this optimization is safe and sets
at_most_one_match: truein the YAML definition. - Click Join.
- In the Add fields dialog, select
c_mktsegment, then click Add 1 field. You can add a joined field anytime after the join has been added.
Joins combine the source table with other tables or queries. For join modeling concepts, including star and snowflake schemas, and YAML patterns, see Work with joins.
Step 3: Define a filter
The complete YAML definition later on this page includes a filter that limits the metric view to orders placed after January 1, 1990. To define the filter:
- Click
 Filter in the upper-right corner of the metric view editor.
 - Set the filter in one of two modes:
- Builder: Select the Column
o_orderdate, the Operator>, and the Value1990-01-01. - Custom: Write the SQL expression
o_orderdate > '1990-01-01'.
- Builder: Select the Column
A filter applies to all queries that reference the metric view. For filter modeling concepts and YAML patterns, see Apply filters.
Step 4: Add fields
The example defines three fields: two transformed columns from the source and one column from the joined customer table. Fields, also called dimensions, behave like regular table columns. A field can be a categorical column used for grouping and filtering, or an unaggregated numeric column that you can aggregate at query time. For more about modeling fields, see Fields.
The editor adds all source columns to the Fields tab automatically. To match the example, remove the columns you don't need so that only o_orderdate, o_orderstatus, and c_mktsegment remain.
To remove a field:
- Click the Fields tab.
- Click the checkbox to the left of the field name to select the fields that you want to remove.
- Click Delete.
To delete individual fields, use the  to the right of the field name.
When you edit a field, you can also add metadata:
- Display name: a descriptive label.
- Comment: a description of the field.
- Synonyms: alternative names that help AI tools discover the field. See Synonyms.
- Format: custom data formatting that controls how values display. Format is only available for numeric, date, and datetime columns. See Format specifications.
- Governed tags: governed tags for classification and governance.
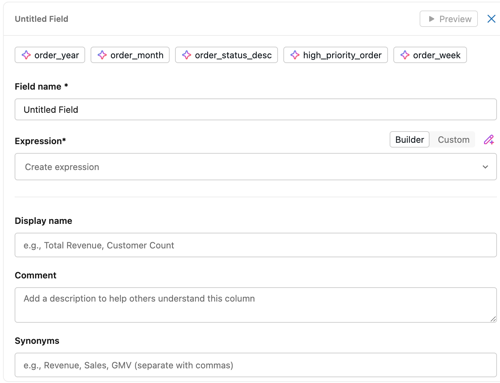
To define each field, click its name on the Fields tab, build its expression, and add an optional comment. To run the transformation and view the result, click  Preview.
-
Order Month: In Builder mode, select
o_orderdateand apply a month transform to produceDATE_TRUNC('MONTH', o_orderdate). Add the commentMonth of order. -
Order Status: In Custom mode, add the comment
Status of orderand enter the following expression:SQLCASE
WHEN o_orderstatus = 'O' THEN 'Open'
WHEN o_orderstatus = 'P' THEN 'Processing'
WHEN o_orderstatus = 'F' THEN 'Fulfilled'
END -
Market Segment: In Builder mode, select the
c_mktsegmentcolumn from the joinedcustomertable. Add the commentCustomer market segment.
Step 5: Add measures
The example defines three measures. Measures are aggregate expressions that produce business metrics, such as total revenue or order count. The editor adds a COUNT(*) measure automatically; you can edit or remove it.
When you edit a measure, you can also add a Display name, Comment, Synonyms, Format, and Governed tags, the same metadata available for fields.
To add each measure, on the Measures tab click +, build its expression, and add an optional comment. To run the aggregation and view the result, click Preview. When you add a measure, Genie suggestions appear at the top of the measure editor pane; click a suggestion to create that measure.
- Order Count: In Builder mode, select the Count aggregation to produce
COUNT(1). Add the commentTotal number of orders. - Total Revenue: In Builder mode, select
o_totalpriceand the Sum aggregation to produceSUM(o_totalprice). Add the commentSum of all order prices. - Total Revenue per Customer: In Custom mode, enter
SUM(o_totalprice) / COUNT(DISTINCT o_custkey). Add the commentAverage revenue per unique customer.
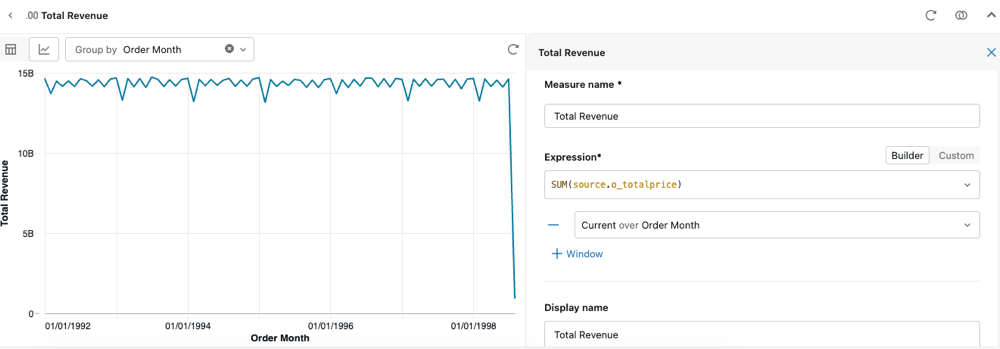
To add a window measure for time-series calculations such as moving averages or running totals, click + Window while editing the measure. See Window measures.
Step 6: Save the metric view
Click Save. The completed metric view matches the definition in Define a metric view in SQL or YAML.
Define a metric view in SQL or YAML
Instead of building a metric view in the UI, you can define it directly in YAML, or in SQL using the CREATE VIEW statement with the WITH METRICS clause. The following is the complete definition of the example metric view. It is a filtered view of samples.tpch.orders joined to samples.tpch.customer, with fields for order month, order status, and customer market segment, and measures for order count, total revenue, and revenue per customer.
These examples use the fields keyword. When you build a metric view in the low-code editor, the YAML it generates uses the equivalent dimensions keyword instead. See Fields.
YAML definition
To define the metric view directly in YAML, use the following definition:
View the YAML definition
version: 1.1
comment: 'Orders KPIs for sales analysis'
source: samples.tpch.orders

joins:
  - name: customer
    source: samples.tpch.customer
    'on': o_custkey = c_custkey
    rely:
      at_most_one_match: true

filter: o_orderdate > '1990-01-01'

fields:
  - name: Order Month
    expr: DATE_TRUNC('MONTH', o_orderdate)
    comment: 'Month of order'

  - name: Order Status
    expr: CASE
      WHEN o_orderstatus = 'O' THEN 'Open'
      WHEN o_orderstatus = 'P' THEN 'Processing'
      WHEN o_orderstatus = 'F' THEN 'Fulfilled'
      END
    comment: 'Status of order'

  - name: Market Segment
    expr: customer.c_mktsegment
    comment: 'Customer market segment'

measures:
  - name: Order Count
    expr: COUNT(1)
    comment: 'Total number of orders'

  - name: Total Revenue
    expr: SUM(o_totalprice)
    comment: 'Sum of all order prices'

  - name: Total Revenue per Customer
    expr: SUM(o_totalprice) / COUNT(DISTINCT o_custkey)
    comment: 'Average revenue per unique customer'
For complete YAML syntax details, see Metric view YAML syntax reference.
SQL statement
To create the metric view in SQL, wrap the YAML definition in a CREATE VIEW statement with the WITH METRICS clause, and place the YAML between $$ delimiters:
View the SQL statement
CREATE OR REPLACE VIEW orders_metric_view WITH METRICS LANGUAGE YAML AS
$$
  version: 1.1
  comment: "Orders KPIs for sales analysis"
  source: samples.tpch.orders

  joins:
    - name: customer
      source: samples.tpch.customer
      'on': o_custkey = c_custkey
      rely:
        at_most_one_match: true

  filter: o_orderdate > '1990-01-01'

  fields:
    - name: Order Month
      expr: DATE_TRUNC('MONTH', o_orderdate)
      comment: "Month of order"

    - name: Order Status
      expr: CASE
        WHEN o_orderstatus = 'O' THEN 'Open'
        WHEN o_orderstatus = 'P' THEN 'Processing'
        WHEN o_orderstatus = 'F' THEN 'Fulfilled'
        END
      comment: "Status of order"

    - name: Market Segment
      expr: customer.c_mktsegment
      comment: "Customer market segment"

  measures:
    - name: Order Count
      expr: COUNT(1)
      comment: "Total number of orders"

    - name: Total Revenue
      expr: SUM(o_totalprice)
      comment: "Sum of all order prices"

    - name: Total Revenue per Customer
      expr: SUM(o_totalprice) / COUNT(DISTINCT o_custkey)
      comment: "Average revenue per unique customer"
$$
Use Genie Code
Genie Code is an AI assistant that you open from the button in the upper-right corner of the editor. Describe what you want in natural language, and Genie Code updates the metric view definition for you. Genie Code is context-aware: on the UI tab it updates the editor for you, and in the YAML editor it inserts YAML.
To add a single measure to an existing metric view, describe it:
Tell Genie Code (Agent mode) to do this for you:
add an average sales per customer measure
To build a complete metric view from a natural language description, describe it to Genie Code. The result is a definition similar to the example on this page; the exact field names and comments can vary.
Tell Genie Code (Agent mode) to do this for you:
Create a metric view on samples.tpch.orders joined to samples.tpch.customer on o_custkey = c_custkey. Add a field for order month by truncating the order date to the month, a field for order status that maps 'O' to Open, 'P' to Processing, and 'F' to Fulfilled, and a field for the customer market segment. Add measures for the total number of orders, the total revenue as the sum of order price, and the total revenue per unique customer. Filter to orders placed after January 1, 1990.
Additional resources
After creating a metric view, use the following resources to query, model, and manage your work.
-
- Query metric views
- Query metric views from SQL editors, notebooks, dashboards, and alerts.
-
- Model metric views
- Model sources, fields, measures, filters, and joins.
-
- Manage metric views
- Control access, enable collaborative editing, and manage the metric view lifecycle.
-
- Metric view YAML syntax reference
- Reference the complete metric view YAML specification.