Use Genie Code for dashboard authoring
This page introduces Genie Code for dashboard authoring, an AI data agent available by selecting Agent mode in Genie Code. Designed specifically for AI/BI dashboards, it creates visualizations, configures layouts, and builds complete dashboards—all from a single prompt.
What is Genie Code for dashboard authoring?
Genie Code for dashboard authoring is a powerful capability in Genie Code's Agent mode that transforms Genie Code into an intelligent companion that can automate entire multi-step dashboard authoring workflows.
Compared to Genie Code Chat mode, Agent mode has expanded capabilities including planning solutions, retrieving relevant assets, creating visualizations, configuring multi-page layouts, applying filters, and fixing errors automatically. The agent works with you to approve its plans and confirm next steps before proceeding. With your approval, it can search tables, create datasets, add visualizations, configure filters, and organize dashboard pages.
Genie Code's access and actions are governed by the user's permissions. It can only access data that you have access to and perform operations that you have permissions for.
Requirements
This feature is in Public Preview.
To use Genie Code for dashboard authoring, your workspace needs the following:
- Partner-powered AI features enabled for both the account and workspace. See Partner-powered AI features.
- Genie Code for dashboard authoring preview enabled. See Manage Databricks previews
Use Genie Code for dashboard authoring
To use Genie Code for dashboard authoring:
-
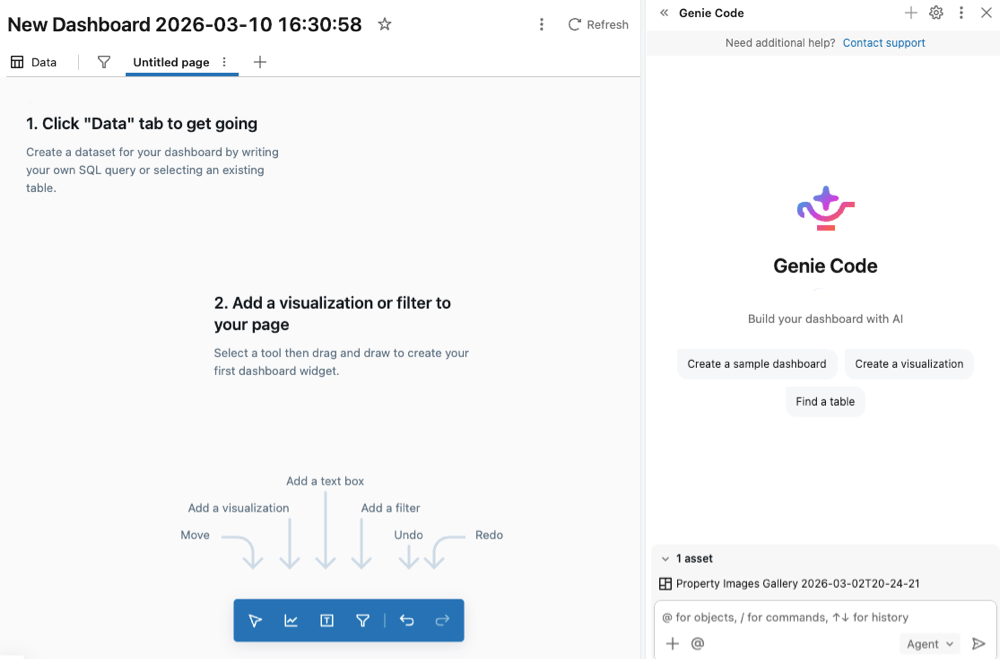
From an AI/BI dashboard, open Genie Code side panel.
-
In the bottom right corner, select Agent. This toggles on Genie Code's Agent mode, allowing you to interact with Genie Code for dashboard authoring.
-
Enter a prompt for the agent. For example, "Create a dashboard showing bakehouse trends using
@sales_transactionsfrom samples.bakehouse."tipReference specific tables by using
@table_name. The agent uses that table and any associated metadata to curate its response. The agent respects the user's Unity Catalog permissions, so it can only access the data that you have access to. -
As the agent generates its response, it often pauses to get your input:
- For more complex tasks, the agent might create a step-by-step plan and ask clarifying questions. Answer the agent's clarifying questions to help it hone its plan.
- When the agent needs to create or modify dashboard elements, it asks for your approval before proceeding. Allow or Decline its request. You can also select Always allow in current thread (referring to Genie Code conversation thread) or Always allow.
- As the agent continues its work, you might be prompted to select Continue or Reject. Review the agent's existing work, then select Continue to allow the agent to continue to its next steps or Reject to tell it to try something else.
- To stop the agent while it is working, click the red
 .
.
The agent can create new datasets, generate visualizations, configure filters, add pages, and organize dashboard layouts to interpret the results.
In order for Genie Code for dashboard authoring to continue its work and take next steps, you need to stay on the current tab the agent is working in.
Use cases
In Agent mode, Genie Code has expanded capabilities, such as finding data, creating visualizations, configuring layouts, and organizing multi-page dashboards.
Genie Code for dashboard authoring can help with complex dashboard authoring tasks, including data exploration, visualization creation, layout design, and filter configuration. You can even create a new dashboard from scratch with Genie Code for dashboard authoring. For better results, provide the agent with context by referencing tables, pipelines, notebooks, queries, and files with @<resource_name>. You can also click ![]() Add context to manually select context to provide. Each reference asset persists in the chat context.
Add context to manually select context to provide. Each reference asset persists in the chat context.
Try the following prompts to get started:
- Dashboard creation:
- "Create a dashboard showing bakehouse trends from the
@sales_transactionstable." - "Build a sales performance dashboard using
@sales_datawith revenue by region and product category." - "Create a customer analytics dashboard from
@customer_datashowing retention, churn, and engagement metrics."
- "Create a dashboard showing bakehouse trends from the
- Visualization creation:
- "Add a line chart showing sales trends over time from this dataset."
- "Create a bar chart comparing revenue across regions."
- "Add a pie chart showing product category distribution."
- "Build a counter widget displaying total revenue for this quarter."
- Data exploration:
- "Which tables contain customer transaction data?"
- "Show me the first 10 rows of the
@sales_transactionsdataset." - "Find a table that contains product inventory data."
- Dashboard layout and organization:
- "Create a new page for regional performance metrics."
- "Organize these visualizations into a two-column layout."
- "Add a text widget explaining the key findings from this dashboard."
- "Clone this page and modify it to show monthly trends instead of weekly."
- Filters and interactivity:
- "Add a date range filter for the entire dashboard."
- "Create a filter to allow users to select specific product categories."
- "Add a region filter that applies to all visualizations on this page."
- Data preparation:
- "Create a dataset from
@sales_transactionsthat aggregates sales by week and product." - "Build a dataset that joins
@customersand@orderstables." - "Add a custom calculation to compute the year-over-year growth rate."
- "Create a dataset from
- Dashboard refinement:
- "Improve the color scheme to make the charts more readable."
- "Add titles and descriptions to all visualizations."
- "Rename this dashboard to 'Q1 2026 Sales Performance'."