Alerts for anomaly detection
This page describes how to set up and view alerts for anomaly detection. For an introduction to anomaly detection, see Anomaly detection.
Alerts notify you when anomaly detection identifies a data quality issue, such as a stale table or an unexpected drop in row count. You can work with alerts in the following ways:
- Data Quality Monitoring UI (Beta): Create and manage alerts directly from the Data Quality Monitoring UI, without leaving the page. See Alerts in the Data Quality Monitoring UI.
- Databricks SQL: Configure an alert by querying the anomaly detection output system table. This approach supports advanced filtering and custom notification templates. See Create an alert with Databricks SQL.
Alerts in the Data Quality Monitoring UI
This feature is in Beta, and is visible to all users by default. Workspace admins don't need to enable the feature from the Previews page.
Alert rules notify selected workspace users by email when an unhealthy table is detected within a catalog or schema. You create and manage these rules directly from the Data Quality Monitoring UI.
Each alert rule is scoped to a catalog or a specific schema. When a monitored table within the rule's scope becomes unhealthy, each recipient receives one email per important unhealthy table.
Required permissions
The privileges required to create or manage an alert rule depend on the rule's scope:
- To create a schema-level alert, you must have the
MANAGEprivilege on the schema. - To create a catalog-level alert, you must have the
MANAGEprivilege on the catalog.
View and manage data quality monitoring alerts
To view your alert rules:
- Navigate to a schema in Catalog Explorer. Data quality monitoring must be enabled for this schema.
- Click the Details tab. Next to Data Quality Monitoring, click View results. This opens the Data Quality Monitoring UI.
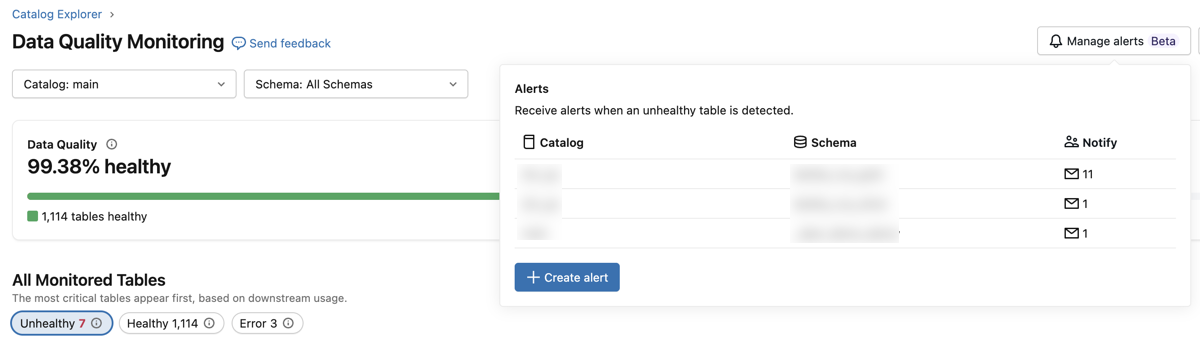
- In the upper-right corner of the page, click Manage alerts. A popover opens showing your existing alert rules, including the catalog, schema, and number of recipients for each rule.
From this popover, you can create a new alert rule, select an existing alert to edit its scope and recipients, or delete the alert.
Create an alert
To create an alert:
-
In the upper-right corner of the Data Quality Monitoring UI, click Manage alerts to open the alerts popover.
-
Click Create alert.
-
Configure the alert rule:
- Catalog: Select the catalog to monitor.
- Schema: Select a specific schema, or select All Schemas to create a catalog-level alert that covers every schema in the catalog.
- Notify: Search for and select one or more workspace users to notify by email.
-
Click Save.
Create an alert with Databricks SQL
By default, only account admins can access the system table system.data_quality_monitoring.table_results. If other users need to configure alerts, make sure to grant appropriate access.
To create an alert on the anomaly detection output results table using Databricks SQL, follow these steps:
-
Click Alerts in the sidebar and click Create alert.
-
Enter the following text in the query editor:
SQLWITH rounded_data AS (
SELECT
DATE_TRUNC('HOUR', event_time) AS evaluated_at,
CONCAT(catalog_name, '.', schema_name, '.', table_name) AS full_table_name,
status,
MAX(downstream_impact.num_queries_on_affected_tables) AS impacted_queries,
MAX(freshness.commit_freshness.predicted_value) AS commit_expected,
MAX(freshness.commit_freshness.last_value) AS commit_actual,
MAX(completeness.daily_row_count.min_predicted_value) AS completeness_expected,
MAX(completeness.daily_row_count.last_value) AS completeness_actual
FROM system.data_quality_monitoring.table_results
GROUP BY ALL
)
SELECT
evaluated_at,
full_table_name,
status,
commit_expected,
commit_actual,
completeness_expected,
completeness_actual,
impacted_queries
FROM rounded_data
WHERE
evaluated_at >= current_timestamp() - INTERVAL 6 HOURS
-- enter the minimum number of table violations before the alert is triggered
AND impacted_queries > :min_tables_affected
AND status = 'Unhealthy';noteFor legacy beta jobs, existing alert configuration should replace
system.data_quality_monitoring.table_resultswith<catalog>.<schema>._quality_monitoring_summary. -
Run the query.
-
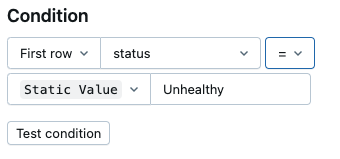
Using the alert editor on the right side of the screen, configure the alert condition. For details, see Create an alert.
-
(Optional) To customize the email template, open the Advanced tab on the right side of the screen, and check Customize template to open the template editor.
An example custom email template is shown below. For more information about custom templates, see Advanced settings.
Html<h4>The following tables are failing quality checks in the last hour</h4>
<table>
<tr>
<td>
<table>
<tr>
<th>Table</th>
<th>Expected Staleness</th>
<th>Actual Staleness</th>
<th>Expected Row Volume</th>
<th>Actual Row Volume</th>
<th>Impact (queries)</th>
</tr>
{{#QUERY_RESULT_ROWS}}
<tr>
<td>{{full_table_name}}</td>
<td>{{commit_expected}}</td>
<td>{{commit_actual}}</td>
<td>{{completeness_expected}}</td>
<td>{{completeness_actual}}</td>
<td>{{impacted_queries}}</td>
</tr>
{{/QUERY_RESULT_ROWS}}
</table>
</td>
</tr>
</table>
Now, you have an alert that triggers based on the downstream impact of the quality issue, helping you debug the table that triggered the alert.