Get started: MLflow Tracing for GenAI in a local IDE
This quickstart helps you integrate your GenAI app with MLflow Tracing if you use a local development environment such as an IDE (VS Code, PyCharm, Cursor, or others) or a locally hosted notebook environment, such as Jupyter. If you use a Databricks notebook, see the Databricks notebook quickstart instead.
This tutorial walks you through:
- An MLflow experiment for your GenAI app
- Your local development environment connected to MLflow
- A simple GenAI application instrumented with MLflow Tracing
- A trace from that app in your MLflow experiment
This quickstart uses the managed experiment backend for the fastest path to your first trace. For scalable, governed storage with no trace limit, Databricks recommends storing traces in Unity Catalog. See Store OpenTelemetry traces in Unity Catalog.
Prerequisites
- Access to a Databricks workspace.
Step 1: Install MLflow
Install MLflow with Databricks connectivity:
pip install --upgrade "mlflow[databricks]>=3.1" openai
Step 2: Create a new MLflow experiment
An MLflow experiment is the container for your GenAI application. For more information, see Experiments.
- Open your Databricks workspace.
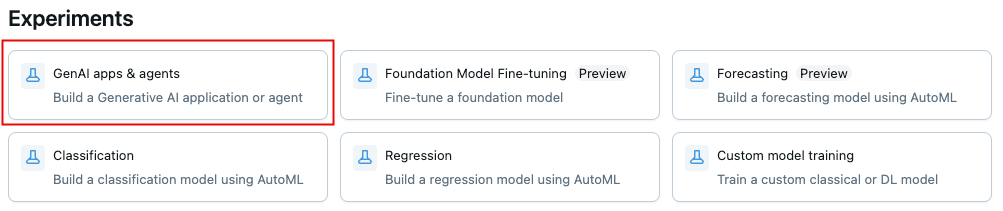
- In the left sidebar, under AI/ML, click Experiments.
- At the top of the Experiments page, click GenAI apps & agents.
- To get the experiment ID and path, click the information icon
 in the upper-left. You use these values in later steps.
Step 3: Connect your environment to MLflow
The following code snippets show how to set up authentication using a Databricks personal access token (PAT). MLflow also works with the other Databricks-supported authentication methods.
- Use environment variables
- Use a .env file
-
In your MLflow Experiment, click the kebab menu icon
 > Log traces locally > Generate API Key.
 -
Copy and run the generated code in your terminal.
Bashexport DATABRICKS_TOKEN=<databricks-personal-access-token>
export DATABRICKS_HOST=https://<workspace-name>.cloud.databricks.com
export MLFLOW_TRACKING_URI=databricks
export MLFLOW_REGISTRY_URI=databricks-uc
export MLFLOW_EXPERIMENT_ID=<experiment-id>
-
In your MLflow Experiment, click the kebab menu icon
> Log traces locally > Generate API Key. -
Copy the generated code to a
.envfile in your project root.BashDATABRICKS_TOKEN=<databricks-personal-access-token>
DATABRICKS_HOST=https://<workspace-name>.cloud.databricks.com
MLFLOW_TRACKING_URI=databricks
MLFLOW_REGISTRY_URI=databricks-uc
MLFLOW_EXPERIMENT_ID=<experiment-id> -
Install the
python-dotenvpackage.Bashpip install python-dotenv -
Load the environment variables in your code:
Python# At the beginning of your Python script
from dotenv import load_dotenv
# Load environment variables from .env file
load_dotenv()
Step 4: Create and instrument your application
Create your GenAI app with tracing enabled.
-
Create a Python file named
app.pyin your project directory. -
Initialize an OpenAI client to connect to either Databricks-hosted LLMs or LLMs hosted by OpenAI.
- Databricks-hosted LLMs
- OpenAI-hosted LLMs
Use
databricks-openaito get an OpenAI client that connects to Databricks-hosted LLMs. Select a model from the available foundation models.Pythonimport mlflow
from databricks_openai import DatabricksOpenAI
# Enable MLflow's autologging to instrument your application with Tracing
mlflow.openai.autolog()
# Set up MLflow tracking to Databricks
mlflow.set_tracking_uri("databricks")
mlflow.set_experiment("/Shared/docs-demo")
# Create an OpenAI client that is connected to Databricks-hosted LLMs
client = DatabricksOpenAI()
# Select an LLM
model_name = "databricks-claude-sonnet-4"Use the native OpenAI SDK to connect to OpenAI-hosted models. Select a model from the available OpenAI models.
Pythonimport mlflow
import os
import openai
# Ensure your OPENAI_API_KEY is set in your environment
# os.environ["OPENAI_API_KEY"] = "<YOUR_API_KEY>" # Uncomment and set if not globally configured
# Enable auto-tracing for OpenAI
mlflow.openai.autolog()
# Set up MLflow tracking to Databricks
mlflow.set_tracking_uri("databricks")
mlflow.set_experiment("/Shared/docs-demo")
# Create an OpenAI client connected to OpenAI SDKs
client = openai.OpenAI()
# Select an LLM
model_name = "gpt-4o-mini" -
Define and run your application:
Use the
@mlflow.tracedecorator, which makes it easy to trace any Python function, combined with OpenAI automatic instrumentation to capture the details of the call to the OpenAI SDK.Python# Use the trace decorator to capture the application's entry point
@mlflow.trace
def my_app(input: str):
# This call is automatically instrumented by `mlflow.openai.autolog()`
response = client.chat.completions.create(
# Uses a Databricks-hosted LLM by default. To use an AI Gateway, Model Serving endpoint, or your own OpenAI credentials, replace `model_name` with a valid model such as `gpt-4o`.
model=model_name,
messages=[
{
"role": "system",
"content": "You are a helpful assistant.",
},
{
"role": "user",
"content": input,
},
],
)
return response.choices[0].message.content
result = my_app(input="What is MLflow?")
print(result) -
Run the application:
Bashpython app.py
For details on adding tracing to apps, see Add traces to applications: automatic and manual tracing and MLflow Tracing Integrations (more than 20 library integrations).
Step 5: View the trace in MLflow
- Return to the MLflow experiment UI.
- The generated trace appears in the Traces tab.
- Click the trace to view its details.

Understanding the trace
The new trace shows:
- Root span: Represents the inputs to the
my_app(...)function- Child span: Represents the OpenAI completion request
- Attributes: Contains metadata like model name, token counts, and timing information
- Inputs: The messages sent to the model
- Outputs: The response received from the model
Even this minimal trace surfaces useful information about your application's behavior, including:
- What was asked
- What response was generated
- How long the request took
- How many tokens were used (affecting cost)
For more complex applications like RAG systems or multi-step agents, MLflow Tracing provides even more value by revealing the inner workings of each component and step.
Guides and references
For details on concepts and features in this guide, see:
- MLflow Tracing - GenAI observability — Start here for in-depth learning about MLflow Tracing.
- MLflow Tracing Integrations — More than 20 libraries with automatic tracing integrations.
- Trace concepts — Understand the fundamentals of MLflow Tracing.