Instrument Node.js applications with MLflow Tracing
MLflow's TypeScript SDK brings MLflow Tracing capabilities to TypeScript and JavaScript applications. Add production-ready observability to your GenAI applications with minimal code changes and leverage Databricks' powerful analytics and monitoring platform.
Requirements
Databricks recommends installing the latest version of the MLflow Tracing TypeScript SDK when developing Node.js applications with tracing.
To instrument your Node.js applications with MLflow Tracing, install the following:
mlflow-tracingfrom the npm registry- Node.js 14 or above
- A Databricks workspace with access to MLflow Experiments
For automatic tracing with OpenAI, you also need:
mlflow-openaifrom the npm registry
Set up the SDK
Install the package
Install the package from the npm registry:
npm install mlflow-tracing
Create an MLflow Experiment
- Open your Databricks workspace.
- In the left sidebar, under AI/ML, click Experiments.
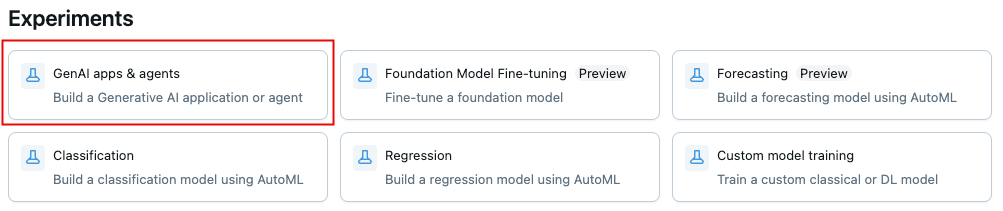
- At the top of the Experiments page, click GenAI apps & agents.
- Click the
 icon next to the experiment name to find the experiment ID and note it down.
Configure authentication
Choose one of the following authentication methods:
- Environment Variables
- .env File
- In your MLflow Experiment, click the
 icon > Log traces locally > click Generate API Key.
 - Copy and run the generated code in your terminal:
export DATABRICKS_TOKEN=<databricks-personal-access-token>
export DATABRICKS_HOST=https://<workspace-name>.cloud.databricks.com
- In your MLflow Experiment, click the icon > Log traces locally > click Generate API Key.
- Copy the generated code to a
.envfile in your project root:
DATABRICKS_TOKEN=<databricks-personal-access-token>
DATABRICKS_HOST=https://<workspace-name>.cloud.databricks.com
Initialize the SDK
In your Node.js application, initialize the SDK with the experiment ID:
import * as mlflow from 'mlflow-tracing';

mlflow.init({
  trackingUri: 'databricks',
  experimentId: '<your-experiment-id>',
});
Automatic Tracing
Add one line of code to automatically trace supported libraries. MLflow Tracing TypeScript SDK currently supports automatic tracing for OpenAI SDK.
To use automatic tracing for OpenAI, install mlflow-openai package:
npm install mlflow-openai
Then, wrap the OpenAI client with the tracedOpenAI function:
import * as mlflow from 'mlflow-tracing';

// Initialize the tracing SDK
mlflow.init({
  trackingUri: 'databricks',
  experimentId: '<your-experiment-id>',
});

import { OpenAI } from 'openai';
import { tracedOpenAI } from 'mlflow-openai';

// Wrap the OpenAI client with the tracedOpenAI function
const client = tracedOpenAI(new OpenAI());

// Invoke the client as usual
const response = await client.chat.completions.create({
  model: 'gpt-4o-mini',
  messages: [
    { role: 'system', content: 'You are a helpful weather assistant.' },
    { role: 'user', content: "What's the weather like in Seattle?" },
  ],
});
Manual Tracing
Tracing a function with the trace API
The trace API is useful when you want to trace a function.
- Named function
- Anonymous function
import * as mlflow from 'mlflow-tracing';

const getWeather = async (city: string) => {
  return `The weather in ${city} is sunny`;
};

// Wrap the function with mlflow.trace to create a traced function
const tracedGetWeather = mlflow.trace(getWeather, { name: 'get-weather' });

// Invoke the traced function as usual
const result = await tracedGetWeather('San Francisco');
import * as mlflow from 'mlflow-tracing';

const getWeather = mlflow.trace(
  (city: string) => {
    return `The weather in ${city} is sunny`;
  },
  // When wrapping an anonymous function, specify the span name
  { name: 'get-weather' },
);

// Invoke the traced function as usual
const result = getWeather('San Francisco');
On the invocation of the traced function, MLflow will automatically create a span that captures:
- Input arguments
- Return value
- Exception information if thrown
- Latency
Capturing nested function calls
If you trace nested functions, MLflow will generate a trace with multiple spans, where the span structure captures the nested function calls.
const sum = mlflow.trace(
  (a: number, b: number) => {
    return a + b;
  },
  { name: 'sum' },
);

const multiply = mlflow.trace(
  (a: number, b: number) => {
    return a * b;
  },
  { name: 'multiply' },
);

const computeArea = mlflow.trace(
  (a: number, b: number, h: number) => {
    const sumOfBase = sum(a, b);
    const area = multiply(sumOfBase, h);
    return multiply(area, 0.5);
  },
  { name: 'compute-area' },
);

computeArea(1, 2, 3);
The trace will look like this:
- compute-area
  - sum (a=1, b=2)
  - multiply (a=3, b=3)
  - multiply (a=9, b=0.5)
Tracing a class method with the @trace API
TypeScript version 5.0+ supports decorators. MLflow Tracing supports this syntax to trace class methods easily. MLflow will automatically create a span that captures:
- Input arguments
- Return value
- Exception information if thrown
- Latency
import * as mlflow from 'mlflow-tracing';

class MyClass {
  @mlflow.trace({ spanType: mlflow.SpanType.LLM })
  generateText(prompt: string) {
    return "It's sunny in Seattle!";
  }
}

const myClass = new MyClass();
myClass.generateText("What's the weather like in Seattle?");
Tracing a block of code with the withSpan API
The withSpan API is useful when you want to trace a block of code, not a function.
import * as mlflow from 'mlflow-tracing';

const question = "What's the weather like in Seattle?";

const result = await mlflow.withSpan(
  async (span: mlflow.Span) => {
    return "It's sunny in Seattle!";
  },
  // Pass name, span type, and inputs as options.
  {
    name: 'generateText',
    spanType: mlflow.SpanType.TOOL,
    inputs: { prompt: question },
  },
);
Create and End a Span Explicitly
To get more control over the span lifecycle, you can create and end a span explicitly.
import * as mlflow from 'mlflow-tracing';

const span = mlflow.startSpan({
  name: 'generateText',
  spanType: mlflow.SpanType.LLM,
  inputs: { prompt: question },
});

span.end({
  outputs: { answer: "It's sunny in Seattle!" },
  status: 'OK',
});
Grouping Traces by Users and Sessions
Many real-world applications use sessions to maintain multi-turn user interactions. On the other hand, traces are often generated per-request. MLflow supports grouping traces by user sessions to help you understand an end-user's journey and identify issues. See Add context to traces guide for more details.
Full-stack example application
Check out the full-stack example for a complete example of how to use the MLflow Tracing TypeScript SDK in a Node.js application.
Additional resources
- Debug and observe your app - Use the Trace UI to analyze your application's behavior and performance
- Evaluate app quality - Leverage your traces to systematically assess and improve application quality
- Production monitoring - Track quality metrics in real-time in production